Wikidemiology
Forecasting isn’t just for sunny skies and drizzly days. Los Alamos scientists are now using open-access digital data to accurately forecast flu and other important infectious diseases.
- Eleanor Hutterer, Editor
In this Information Age, the answer to nearly any question is just a couple of clicks away. Got a question? Google it, then click the most promising result. That’s all there is to it. We all do it—it’s become standard operating procedure for information-seeking in the modern, wired world. And it’s not just curiosities and factoids, like the rules to unicycle hockey or the gross domestic product of Wales; information on important events and changing trends is sought in the same way.
The 2014–2015 flu season has died down, and so too, for now, has traffic on flu-related websites. When someone thinks he might have the flu, the first thing he does (maybe the second thing, after changing into pajamas) is to Google his symptoms: “fever and cough,” or minimally, “flu,” searching for confirmation of his suspected diagnosis and maybe a way to beat it. Frequently, among the top search results, is a Wikipedia article containing a wealth of information on influenza, similar illnesses, symptoms, treatments, complications, history, and more. Because so many people use Wikipedia, and because all this activity creates records, (i.e., data), the result is essentially a real-time, worldwide survey of what’s on people’s minds. Now, a charismatic multidisciplinary team of researchers at Los Alamos has tapped into this rich resource with the aim of forecasting infectious disease outbreaks more precisely and more broadly than has ever been done before.
“Most infectious disease modeling has sought to understand disease dynamics. It’s only recently that there has been much thought given to actual forecasting,” says applied mathematician Sara Del Valle, who heads the team. Forecasting, she explains, is often erroneously equated with predicting. Whereas a prediction portends a discrete onset of a future event, a forecast is rooted in the present moment. It takes a phenomenon that is already underway, looks at what has happened so far, and makes forward projections of what is likely to happen in the near future. Using data from Wikipedia, Del Valle and her team have demonstrated the success of their forecasting model and now are taking it up a notch.
Quality of data
Launched in 2001, Wikipedia has become the most frequently accessed website worldwide that is neither social-media platform nor search engine. It is a free, open-access, online encyclopedia that exists in hundreds of languages throughout the virtual world. The site’s content can be edited by anyone who has something to add and cares to take the time to register. (There are roughly 70,000 regular contributors and editors, who get to call themselves “Wikipedians.”)
The Wikimedia Foundation is a nonprofit organization that provides a home for Wikipedia but does not govern it. In the spirit of public service, the foundation’s mission includes full transparency, open accessibility, and unrestricted dissemination. In addition to Wikipedia’s content being available to all, data about the content, like how often it’s viewed or edited, is also available to anyone who asks. Every time a page is viewed, an anonymous record is created, and those aggregated records are available for free, in their entirety, updated every hour going back to 2007. Anyone can find out how many times the unicycle hockey article has been viewed in any language for any time frame. This is considerably better than other Internet activity-based massive data sets, some of which charge high fees or only provide certain types or quantities of data.
This is part of what makes the Los Alamos team’s forecasting model unique. Other efforts have relied on different types of data or been structured differently. For example, Google search terms can be used to see what kind of health information people are seeking and Twitter feeds can be used to see what kind of health information people are sharing. But neither of these resources is as forthcoming with its data as Wikipedia. Google launched its own influenza forecasting service, Google Flu Trends, in 2008 and more recently debuted Google Dengue Trends; these are similar in scope but lack transferability and transparency (although Google is beginning to experiment with transferability). Del Valle’s team, by using the reliable, comprehensive, and open data of Wikipedia, has ensured that the models it builds may be extended and improved upon by anyone, for any disease, in any location, at any time.
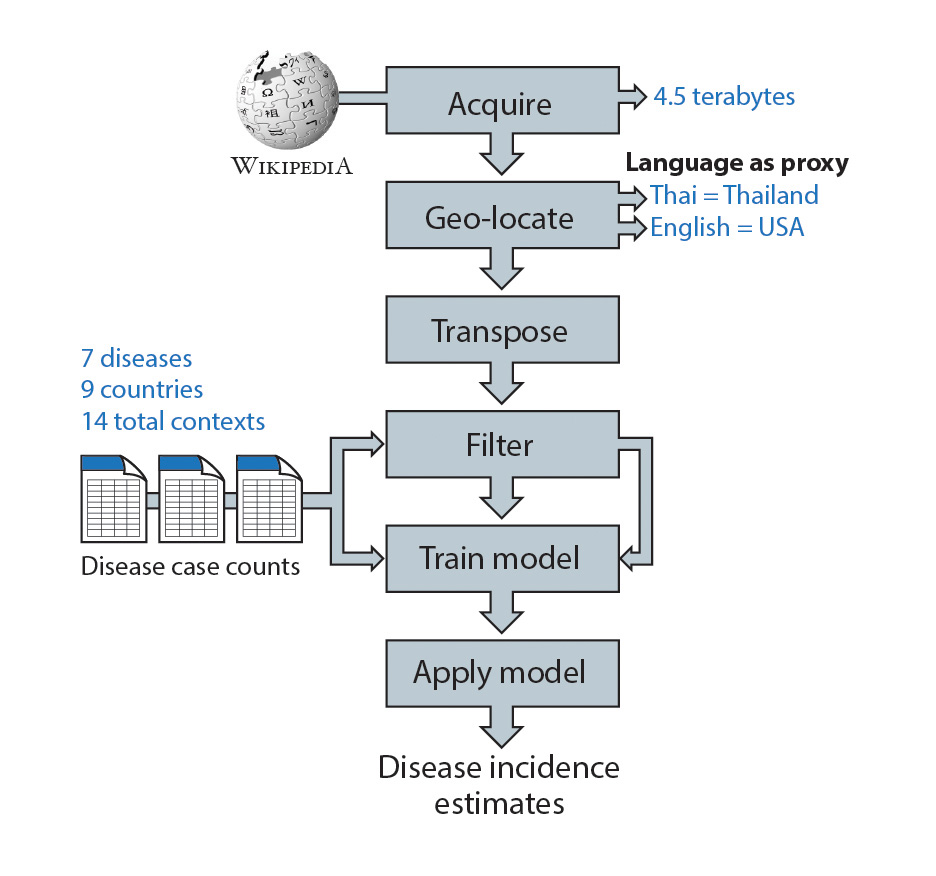
Another perk that the Wikipedia data bring to the table is the use of language as a proxy for location. This is usually a tight relationship—the vast majority of people in Thailand reading up on dengue fever will visit Wikipedia’s Thai-language dengue article. Similarly, most Wikipedia searches from Norway will be in Norwegian, and most searches originating in Japan will be in Japanese. But there are a few correlations that are not as clean. For example, although most web searches coming from within the United States will be in English, so will most searches from Canada, the United Kingdom, Ireland, Australia, and New Zealand, as well as numerous countries throughout the Caribbean, Africa, Asia, and Oceania. This complication also affects location determination from web traffic in Spanish, French, and Portuguese, each of which is a predominant language in multiple countries.
Then what if there is an outbreak in Panama (Spanish), Haiti (French-based Creole), or Brazil (Portuguese)? How can the model forecast disease in places that are not the only correlate to their primary language? In some cases the answer is in the question. For example, dengue is more prevalent in Brazil than in Portugal, so Portuguese-language Wikipedia hits for dengue will better correlate to Brazilian web traffic than to Portuguese web traffic. In other cases, one country accounts for enough of the total traffic that a correlation can still be made. The United States produces 40 percent of Wikipedia’s English-language traffic, which is higher than the proportion accounted for by any other English-speaking country, thus English serves as a proxy for the United States. Spanish is trickier, though, with similar proportions of Spanish Wikipedia traffic originating in both Spain and Mexico. Finer geographic resolution is an area of active research for Del Valle and her team.
Quantity of data
The Wikipedia data are reported as aggregate counts of page requests, or hits, for all articles in any of the 287 languages represented in Wikipedia. (Page views are ideal, but page requests are what’s available.) A collection of every article’s hits per hour, for every hour going back to 2007, consists of over 70,000 data points for each article. So when Reid Priedhorsky, a computer scientist on Del Valle’s team who specializes in data-intensive computing, downloads the data, he gets 4.5 terabytes of data—a figure that grows by two gigabytes every day.
But not all 4.5 terabytes get to stay. The next step is to reduce and filter the data, so the informative stay and the uninformative are removed. Wikipedia provides its data in the format of “for each hour, how many times was each article requested.” In a complex process called transposition, Priedhorsky and Geoffrey Fairchild, another computer scientist and programmer on the team, change the format subtly but importantly to “for each article, how many times was it requested each hour.” This generates a time series across which the researchers can identify windows of unusually high traffic to that page, which appear in the time series as peaks rising above the background noise.
Each article also has dozens of links to similar articles (e.g., “Influenza virus,” “Swine influenza,” and “Viral pneumonia,” all link to the “Influenza” article). These get ranked based on correlation to the best available public-health data, such as influenza statistics from the Centers for Disease Control and Prevention (CDC), and the 10 best-correlated articles are included in the analysis. The team groups disease articles in particular languages with specific countries, creating disease-country pairs, which are referred to as “contexts.” So influenza in the United States (English language) will be a different context from plague in the United States and also from influenza in Poland (Polish language). By choosing specific and diverse contexts in this way, and further widening their net by including correlated articles, Fairchild and Priedhorsky built a robust proving ground for the fledgling forecast system. The 14 contexts used for their pilot study were: influenza in Japan, Poland, Thailand, and the United States; tuberculosis in China, Norway, and Thailand; dengue in Brazil and Thailand; HIV in China and Japan; cholera in Haiti; Ebola in Uganda; and plague in the United States. The next step was to test the predictive power of Wikipedia traffic to each context against actual case data from the chosen countries.
Proof of principle
Epidemiologists and other disease detectives rarely know the state of affairs at the present moment. Usually the best they can do is the state of affairs last week or two weeks ago. Because actual case data, like influenza infection rates, need to be collected and tabulated by clinics and counties before being summarized and reported by state and federal health agencies, there is a time lag between what is happening and what is known. But with a good statistical estimation model, the situation right now can be extracted from what is known in what’s called nowcasting.
In order to determine the utility of a modeling system, it must be fed historical data and allowed to make projections as if in real time—then the resulting nowcast can be compared to the historical record for validation. For this training phase, team member Nick Generous, a self-styled microbiologist-turned-epidemiologist, collected the latest historical data from the CDC and its foreign counterparts. Cases of confirmed infection, as determined by clinical testing, and cases of probable infection, as determined by patient description of symptoms and doctor observation (as well as, in some instances, cases of possible infection as determined by non-doctor clinicians), were collected for recent three-year periods for each of the 14 test contexts.
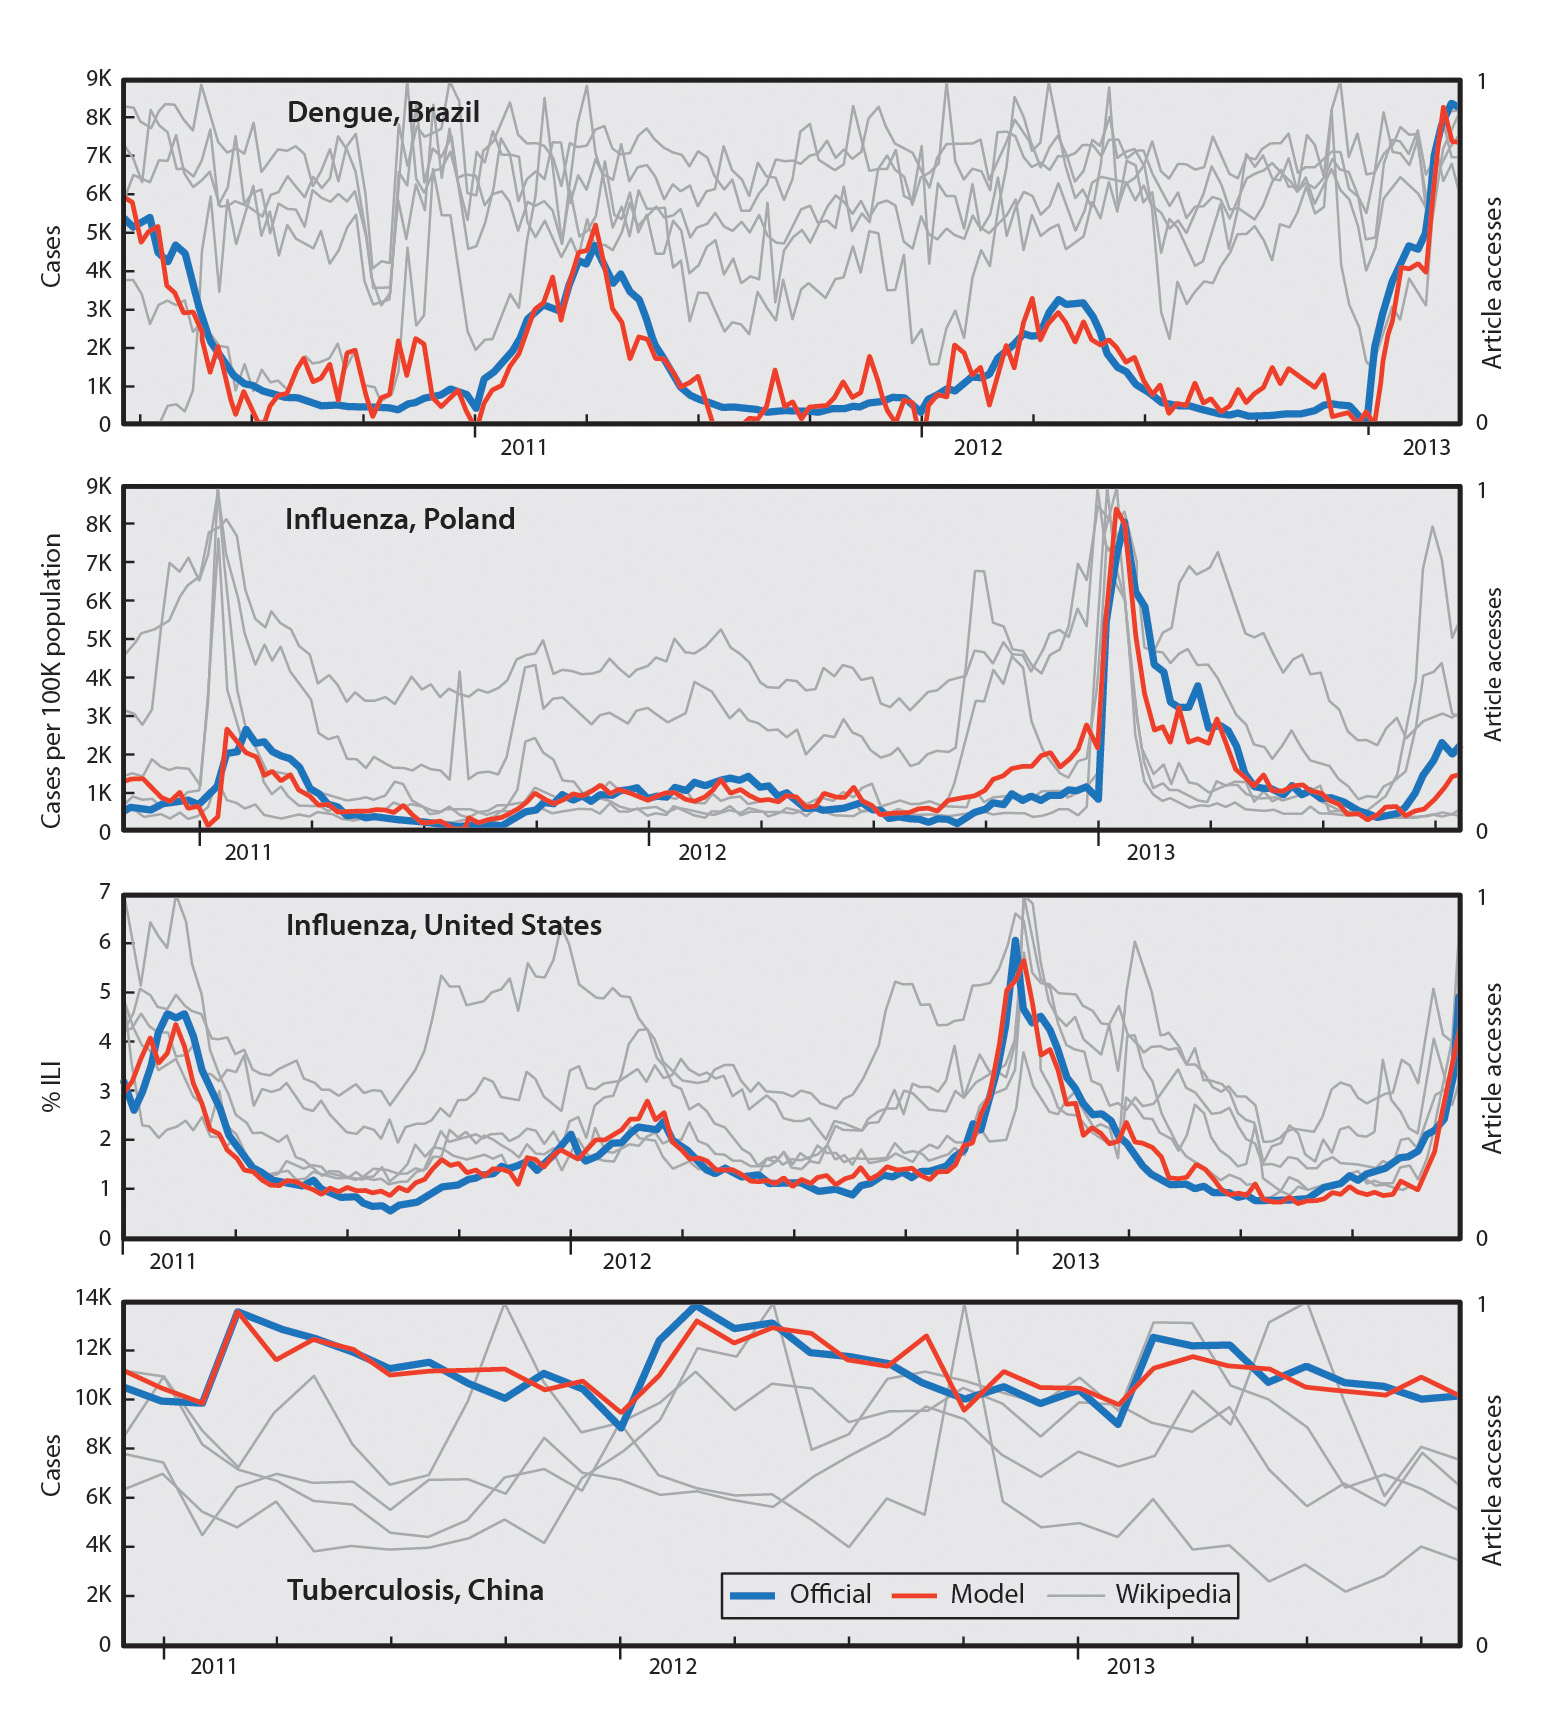
Next, Del Valle and Los Alamos mathematician Kyle Hickmann trained linear regression models by mapping Wikipedia hits for each context to the official case data collected from disease-monitoring agencies. When the case data were compared to the Wikipedia traffic, the results were mixed. In eight of 14 contexts, the Wikipedia-based nowcasts mirrored the official case counts. The remaining six contexts suffered from two particular challenges: no detectable pattern in the official data or no detectable pattern in the Wikipedia data.
No detectable pattern in the official data could occur in instances of slow disease progression, as would be seen with HIV or tuberculosis, and indeed, these were among the contexts that failed. No detectable pattern in the Wikipedia data could occur in instances where unrelated hits drown out hits associated with infection. For example, since the start of the still-ongoing, record-shattering Ebola outbreak, web traffic about Ebola will undoubtedly correlate to locations with high media coverage and Internet access, whereas actual Ebola infections tend to occur in regions with poor media and web connectivity.
Media frenzy can be a major confounding factor for mathematical models trained on patterns of web traffic. If there is a sudden surge of news coverage on a topic like Ebola, there will be a corresponding surge of web traffic from the curious and web-connected. If the model was trained with a lower baseline, as existed before the heightened media coverage, it may interpret the increased interest as increased infection. So the forecast falls apart unless the human programmers intervene outside of the usual annual evaluation, which in the case of Google’s models they usually don’t. Google Flu Trends famously missed the H1N1 swine flu pandemic in 2009 for similar reasons; the outbreak didn’t follow the patterns for seasonal flu, and there was such a flurry of media-driven web traffic that the infection-driven pattern got buried in the media-driven surge.
What Del Valle’s team sought to remedy, compared to the current state of the art for disease nowcasting, was four-fold. First, models should be completely open, in terms of data source and algorithms used, so that others may replicate, deploy, or even improve upon them. Second, models should be transferable from one context to another with minimal cost and effort, so as to maximize relevance and impact. Third, models should be translatable to regions where official incidence data are not available and, having been trained on trusted incidence data elsewhere, still be able to produce accurate forecasts. Fourth, models should be able to reliably forecast the future course and not just the present situation of an outbreak. Whereas other systems like Google Flu Trends do a decent job of nowcasting, the Los Alamos team’s system goes even further—it goes into the future.
Forecasting flu
Buoyed by their considerable success with the proof of principle, the team was ready to prove that their system could work in real time. The 2013–2014 flu season was right around the corner and, as luck would have it, the CDC was conducting a contest, called the Predict the Influenza Season Challenge, which posed the problem of flu forecasting to innovators far and wide. The CDC tracks actual influenza infection—as well as anything that has a similar clinical presentation; i.e., fever, cough, and sore throat with no other identifiable cause—and posts this influenza-like-illness (ILI) case data online every week. The challenge was to build a model capable of producing the most accurate forecast, as measured by comparison to the CDC’s official ILI data.
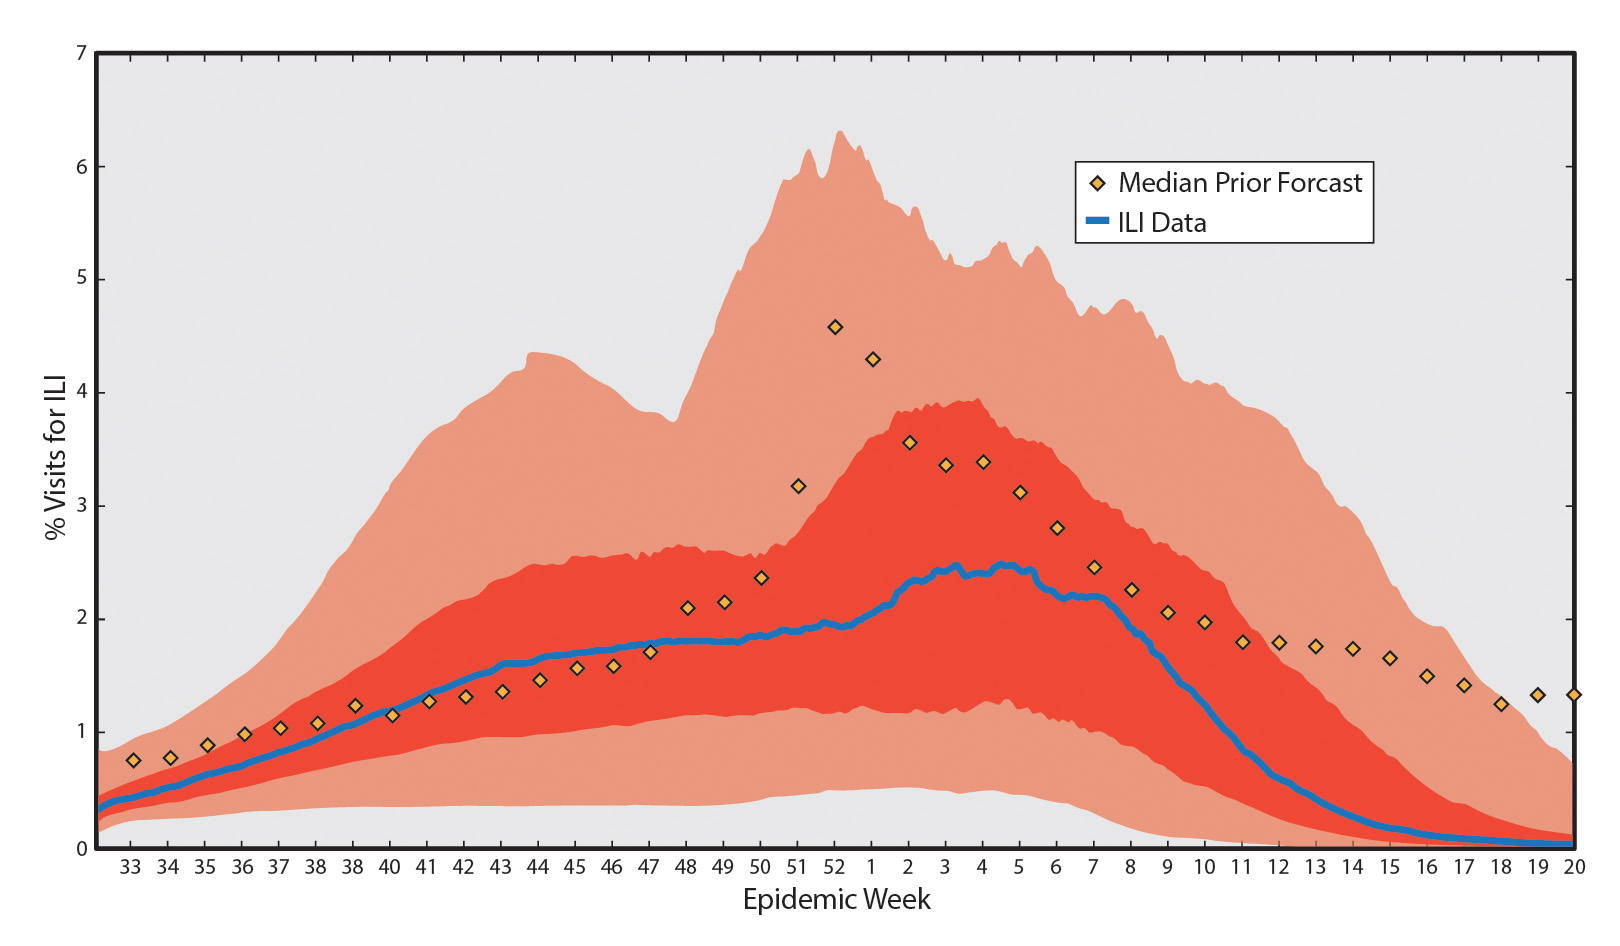
Using techniques derived from meteorological forecasting and the ILI historical data for the previous 10 years, Hickmann created what is referred to in epidemiology as a SEIR model, which sorts the entire population into four categories, based on influenza status: susceptible, exposed, infected, and recovered. By modeling 10 previous flu transmission seasons, the team produced a distribution broad enough to reliably include the new flu transmission season. It was an iterative process with new ILI and Wikipedia data being incorporated as the season rolled on, and the forecast automatically adjusted accordingly. They also built a straw-man model—that is, a model that uses only historical data and takes the average of all previous outbreaks to make projections—in order to validate and justify their methodology in the SEIR model. Because the straw man is of simplistic construction, it provides a benchmark for minimal performance by the more intricate SEIR model.
Influenza season in the United States lasts from mid-August through mid-May and the number of infected people during this time often has two peaks, a smaller peak in late November or early December and a larger peak during February. Although some of the finer features of the ILI distribution were not well captured by the SEIR forecast (e.g., the smaller first peak), the overall distribution of ILI incidence, including start week, peak week, duration, and peak level, fell almost entirely within its 90-percent credible region. And, not surprisingly, the later in the season the forecast was generated, the better the fit. In fact, the Los Alamos team’s model was able to accurately predict ILI incidence up to several weeks in advance, which is a far cry better than the two-week time lag that comes from ILI data alone. Although the team didn’t win the CDC challenge (a team from the Mailman School of Public Health at Columbia University took home the prize), they were among the top performers, and, more importantly, they achieved their four-fold goal of building a model that includes openness, breadth, transferability, and forecasting. And they don’t intend to stop there.
The future of forecasting
“It’s the Wild West right now,” says Generous. “We’re entering a new frontier of digital epidemiology, and there’s so much that hasn’t been done. It’s really wide open.” One thing he’s especially excited about is the possibility of using similar methods to track and forecast non-communicable diseases. Like cancer. Or depression. Or Alzheimer’s, autism, diabetes, heart disease, obesity, and a dozen others. This is another reason transferability is so important; the ability to apply their model to so many other important illnesses, especially in locations where there is no surveillance or monitoring in place, is quite powerful.
In addition to broadening the application of their forecast system, the Los Alamos team is still working out some of the residual kinks. The team is now working on how to handle web-traffic surges caused by media coverage and other exogenous events without producing an erroneous spike in inferred cases, as well as how to improve pattern resolution for the failed contexts. Then there’s the also-ran problem—that is, how to parse out activity in countries that aren’t the top representative of web traffic in their primary language. Priedhorsky is working on this and says the most fruitful path forward will likely lie in aggregating hits by country, state, and city rather than globally, which has to happen at the Wikimedia Foundation, not at Los Alamos. But he is working closely with Wikimedia staff toward this goal and is optimistic that it’s not too far off. “Our larger ambition is to know the prevalence of any disease in any location for any time, present or future, which will help target resources more effectively,” he says.
The ultimate goal, then, is an operational system, like a website, that is reliable, visible, and easily accessible by the public. One possible platform for this is Los Alamos’s new Biosurveillance Gateway. Led by team member and infectious disease expert Alina Deshpande, it’s an online portal for news, information, and all things biosurveillance. The Gateway brings together numerous Los Alamos research projects to address national security as well as public health challenges and would be an ideal home for the disease-forecasting tool.
With ever-increasing appreciation of the importance of pathogens, and recently improved abilities to model and forecast their spread, it’s a good time to be in the infectious disease business. “The government has renewed interest in disease forecasting,” says Del Valle, “and this work has the potential to change behavior, from public policy all the way down to vaccine sentiment. We are really well positioned here, with such a strong, multidisciplinary team, to achieve the transferability we’re talking about. And that will be huge.” As web connectivity increases, she points out, and more people throughout the world get online, the data and the forecasts will only get better.