Quick Urban & Industrial Complex (QUIC) Dispersion Modeling System
Fast Building Aware Atmospheric Dispersion Modeling
What is QUIC?
The Quick Urban & Industrial Complex (QUIC) Dispersion Modeling System is a fast response urban dispersion model that runs on a laptop. QUIC is comprised of a 3D wind field model called QUIC-URB, a transport and dispersion model called QUIC-PLUME, a pressure solver, QUIC-PRESSURE, and graphical user interface called QUIC-GUI. Chemical, biological, and radiological (CBR) agent dispersion can be computed on building to neighborhood scales in tens of seconds to tens of minutes.
QUIC will never give perfect answers, but it will account for the effects of buildings in an approximate way and provide more realism than non-building aware dispersion models.
QUIC Capabilities
Radiological dispersal devices (RDD's) with buoyant rise
Dense gas chemical agent dispersion with topographical effects and two-phase droplet thermodynamics
Evaporating liquid pool with 2D shallow water pool spread algorithm
Multi-particle size biological agent dispersion
Bio slurry (evaporating droplet) dispersion
2-phase (droplet/vapor mixture) dispersion with secondary evaporation from surfaces
UV decay
Inhalation model to estimate the amount of agent deposited in various regions of the respiratory tract
Toxic load
Line, area, volume, and moving point sources
Building infiltration and exfiltration
Deposition on building surfaces
Nested grids
Meteorological data assimilation
Vegetative canopies
Pressure distribution on buildings
2D and 3D graphics visualization
Affected population calculator with an included CONUS population database
The QUIC Graphical User Interface allows one to create building geometries graphically, enter meteorological conditions, graphically define source parameters and simulation parameters, and run the Fortran executables. The QUIC-GUI includes 2D and 3D plotting capabilities, including streamlines, vectors, contours, iso-surfaces, and line plots.
Most all model-computed parameters can be plotted in 3D around the buildings, including mean wind variables, turbulence information, airborne concentrations, airborne toxic load, airborne inhaled dose, lethal concentration thresholds, probit response contours, and deposition fields.
The QUIC-GUI includes several additional tools for data analysis:
Inhalation model to calculate the amount of agent deposited in various regions of the respiratory tract
Population exposure calculator with included daytime and nighttime population databases
A movie maker tool to save animations as AVI, GIF, or numbered image files
An export tool that can output data in spreadsheet format, and shape files.
QUIC-URB
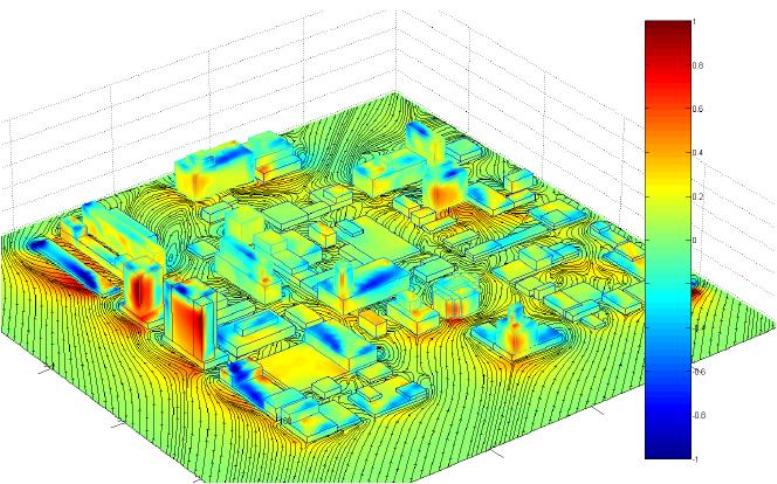
QUIC-URB is a fast running model for computing mean flow fields around buildings. It uses empirical algorithms and mass conservation to quickly compute 3D flow fields around building complexes. The underlying code is based on the work of Röckle (1990). Flow parameterizations for the downwind cavity and wake, upwind cavity, rooftop recirculation zone, the street canyon vortex, and intersections are applied to buildings based on the prevailing wind direction and their height, width, length, and spacing. Mass conservation is then imposed and a 3D wind field is produced.
Some of the original Röckle schemes have been modified to better agree with experimental data and new schemes have also been introduced (see QUIC Reports). QUIC-URB has been modified to account for dense urban areas, semi-complex building shapes, and forest-induced drag. The model can assimilate wind measurements (e.g., SODAR profiles) and has a nested grid capability so that larger problems can be run (i.e., the inner grid resolves buildings and the outer grid does not). For small problems of a few buildings, the code runs in seconds on a standard single processor laptop. For larger problems with a few million grid cells encompassing several square kilometers in a downtown built-up area, the code may take from 5 to 15 minutes to run. Numerous evaluation studies have been performed and can be found on the QUIC Reports page.
Capabilities
Assimilates multiple meteorological data sources or mesoscale meteorological model data to initialize wind fields.
Wind profiles can be produced from point measurements using logarithmic, power-law, or urban canopy logarithmic parameterizations.
Vegetation Canopies
QUIC-PLUME
QUIC-PLUME is a Lagrangian random-walk dispersion model for computing concentration fields around buildings. It has been adapted to work in the inhomogeneous environment of cities. It includes more terms than the normal random-walk model in order to account for the 3D gradients in turbulent and mean flow fields. It includes reflection terms for building and street surfaces. The dispersion of aerosols and gases can be simulated, including deposition, gravitational settling and health properties. Point, moving point, line, area, and volume sources can be simulated. An explosive buoyant rise and multi-particle size capability has been added for dealing with Radiological Dispersal Devices (RDD's).
A dense gas cloud model has been incorporated in order to evaluate the effects of heavier-than-air chemical industrial gas dispersion. QUIC-PLUME also has the option of adding the effects of two-phase (vapor/droplet) thermodynamics on dense gas dispersion. There is also a model for UV agent decay which incorporates the effect of time of day, day of the year, geographic location of the release, and cloud cover. The model contains a simple outdoor-to-indoor infiltration parameterization that allows for calculation of indoor concentrations inside of single zone buildings.
QUIC-PLUME can run in tens of seconds for smaller problems, but may take up to 30 minutes for large problems where a half million or more particles are to be released. The code has been tested for both idealized and real-world cases (e.g., Gowardhan et al., 2006; Williams et al., 2004). For more information on the specifics of the code, see the QUIC-PLUME Theory Guide.
Capabilities
Simulates chemical, biological, and radiological agents
Several source geometries including:
spherical shell or volume
segmented line
moving point
circular or rectangular area
cylindrical or rectangular volume
explosive
Dense gas (with or without two-phase thermodynamics)
Evaporating liquid pool with 2D shallow water pool spread algorithm
QUIC-PRESSURE
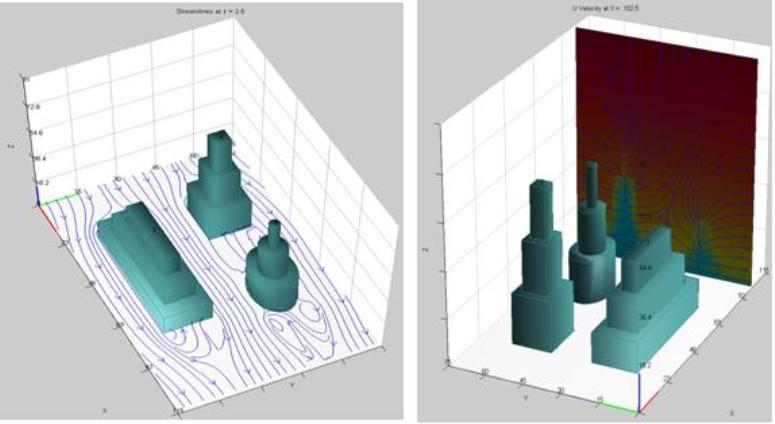
Using the mean 3D velocity field produced by QUIC-URB, QUIC-PRESSURE solves for the 3D pressure fields through use of the pressure Poisson equation. Pressures can be used to help determine building leakage, as well as wind loading. More details on the pressure solver equations and evaluation studies can be found in Gowardhan et al (2006).
Capabilities
Computes 3D pressure fields in and around buildings.
Computes pressure on building surfaces.
Publications
Example Animations
Nested Grid Mesoscale Model Wind Data Assimilation
The outer grid wind fields are initialized using a 3D wind field produced by MM5 (above left). The winds in the outer grid are used to initialize inner grid (above right) which resolves individual buildings.
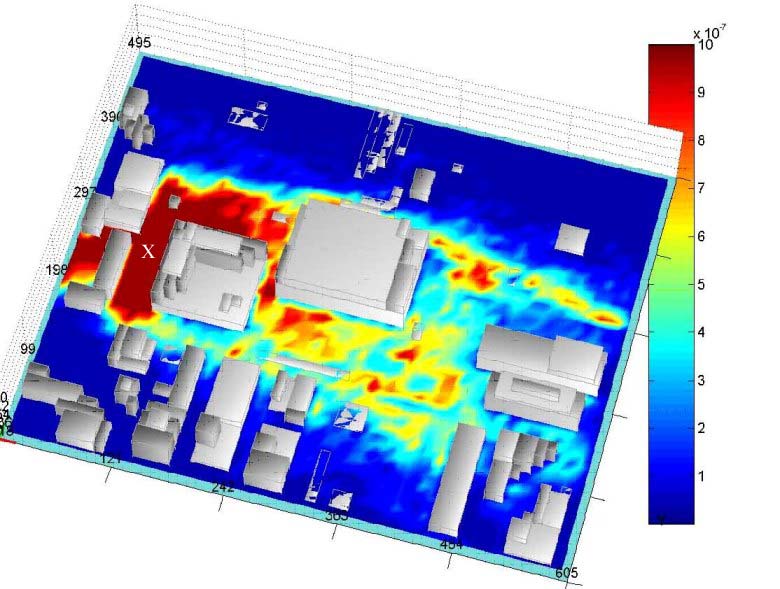
Once the wind fields have been computed on both the inner and outer grids, the plume is calculated on the inner grid (above left) and subsequently travels to the outer grid (above right). The source in this example is a moving point source traveling at 15 m/s. Note that color scales are the same on both grids.
Fly-Through Visualization of Data
An instantaneous release within an urban core. Particles are colored by concentration.