| The Slitting Method for Residual Stress Measurement: : Application to ring |
Residual stress measured in a hardened (carburized and quenched) steel ring
Paper on these measurements and some nice FEM predictions:
M. B. Prime, V. C. Prantil, P. Rangaswamy and F. P. Garcia, "Residual Stress Measurement and Prediction in a Hardened Steel Ring," Materials Science Forum, Vols. 347-349, pp. 223-228, 2000. preprint (pdf) (LA-UR-99-5103)
The finte element model described in this paper includes phase transormation kinetics and transformation induced plasticity (TRIP).
The Specimen:
|
|
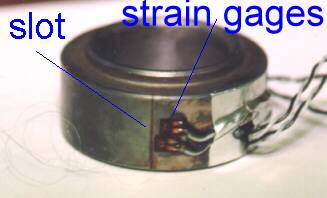
The test
|
|
The raw data - measured strains
Great Sensitivity! - Look how big the strain readings are
The results - residual stress
- This is Hoop residual stress in the first mm or so of depth
- See paper (pdf) for information on finite element model and surface x-ray measurements
- The residual stress is given as a 4th order polynomial from the least squares fit used to reduce the data
- How well does this fit the strain data? See below
Fit to the strain data
- The solid lines are the strains predicted analytically by the residual stress distribution shown above
- The symbols are the actual data
- The ± 1 microstrain fit error corresponds well with how well you can measure strain
- The compliances were calculated using the solution for a slot of finite width, reference # 20
NOTE: The raw data from this test and any other data I have can be made available for research purposes. Just email me.