Practical
Application of Thermal Ionization Mass Spectrometry for the Determination of
Plutonium for the LANL Bioassay Program
(LA-UR-00-1697)
Sandra
E. Wagner*, Stephanie Boone, John W. Chamberlin, Clarence J. Duffy, Deward W.
Efurd, Kimberley M. Israel, Nancy L. Koski, Diana L. Kottmann, Dawn Lewis,
Peter
C. Lindahl, Fred R. Roensch, Robert E. Steiner
Los Alamos National
Laboratory, P.O. Box 1663, MS J514, Los Alamos, NM, USA 87545
Presented
at the Fifth International
Conference
on Methods and Applications of Radioanalytical Chemistry (MARC V)
Kailua-Kona,
HI, USA, April 9-14, 2000
This
paper discusses the practical application of thermal ionization mass
spectrometry for the determination of ultra low-level plutonium in urine for
the Los Alamos National Laboratory Bioassay Program. Utilization of thermal ionization mass spectrometry as a routine
analytical service provided to the Los Alamos National Laboratory internal
dosimetry group has evolved significantly since its implementation just over
three years ago. Converting this unique
research tool designed to support nuclear weapons testing to a quasi-production
mode for the routine analysis of ~300 urine samples/year has required resolution
of numerous practical issues. These
issues include clean-room sample preparation, adequate tracer recovery,
customer specified turn-around times, throughput, water and urine blank values,
statistical data reduction, and quality control and performance evaluation
sample requirements. Ongoing
improvements identified include software development and electronics upgrades
to allow automation of the system for reduced labor costs and increased
efficiency.
INTRODUCTION
Routine
bioassay monitoring for Department of Energy workers who may incur intakes of
radioactive materials resulting in a committed effective dose equivalent of 100
mrem (0.1 mSv) is mandated by United States law [1]. To provide the level of measurement sensitivity necessary to meet
this monitoring requirement, Los Alamos National Laboratory (LANL) developed an
ultra-sensitive analytical procedure through the application of thermal
ionization mass spectrometry (TIMS) for determination of plutonium-239/240 in
urine samples [2].
Since the days of the Manhattan
Engineering District Project, plutonium-worker monitoring was accomplished
through radiochemical alpha spectroscopy (RAS), which besides being less
sensitive, cannot distinguish between the isotopes of plutonium-239/240. However, RAS remains the technique for the
determination of plutonium-238 and -239 in routine monitoring, and TIMS is used
as an adjunct for baseline and front-line plutonium workers providing more
sensitive determinations of plutonium-239, and the 239/240 ratio.
For over 40 years, TIMS was a well-established
research tool used for analysis of one-of-a-kind samples. Since the addition of the TIMS procedure to
the LANL Bioassay Program in January 1997, numerous technical and management
challenges have been encountered during the transition from a specialized
research tool to a production analytical technique. Chemical separation procedures used in the determination of RAS
levels of plutonium were not suitable for the more sensitive TIMS analyses. Numerous opportunities for quality
improvement have occurred in the three years of routine TIMS operations to
support the LANL Bioassay Program. These lessons could only be learned once
TIMS was implemented, as the first series of problems had to be solved before
the next set of challenges were identified.
PLUTONIUM PROCESS CHEMISTRY
RAS Analysis
All LANL Bioassay
Program samples are analyzed for plutonium by RAS first, and then if requested,
by TIMS. The RAS portion of the process
starts with determination of sample parameters (temperature, weight, and specific
gravity). Plutonium-242 tracer is added
to the sample prior to processing.
Calcium nitrate, phosphoric acid and ammonium hydroxide are added to the
urine to precipitate the plutonium from solution. The sample is centrifuged, and the supernatant liquid is decanted
and discarded, leaving the precipitated plutonium solids. The solids are dissolved in nitric acid and
heated. The solution is then
transferred into a Class-100 clean-room.
The nitric acid solution is passed through an anion exchange column, and
the plutonium is eluted from the column with hydrochloric acid followed by a
hydroiodic acid solution. The solution
is evaporated to dryness. The sample is
redissolved in a sodium bisulfate-sodium sulfate solution and electroplated
onto a stainless steel planchette. The
planchette is alpha counted for plutonium-238 and-239.
TIMS Chemistry
All chemistry done to
support the preparation of the TIMS samples is conducted in a Class-100
clean-room environment. The stainless steel planchette from alpha-spectroscopy
analysis is washed with a hydrofluoric/nitric acid solution to remove the
plutonium. The plutonium solution is passed through an anion exchange column
and the plutonium is eluted from the column with a hydrochloric/hydroiodic acid
solution. The sample is evaporated to dryness and re-dissolved in a
hydrochloric acid/hydrogen peroxide solution. The sample is loaded onto a
second anion exchange column and the plutonium is eluted with hydrobromic
acid. The plutonium solution is
evaporated to dryness in a pre-cleaned quartz test tube.
TIMS Analysis
The solid material is
dissolved in a buffered hydrochloric acid-ammonium hydroxide solution. The plutonium is co-electroplated with
platinum onto a rhenium filament. The
platinum-plutonium layer is overplated with platinum. The filament is inserted into the ion source of the mass
spectrometer, and a current is passed through the filament causing the
plutonium atoms to ionize. The ions are accelerated through a magnetic field,
resulting in separation of the ions by mass, with heavier ions having more
momentum. The amount of plutonium-239
in the original sample is calculated by comparing the number of those ions to
ions resulting from a known amount of plutonium-242 tracer. TIMS analytical
operations are conducted in a Class-100 clean-room environment.
CONTRACTUAL
PERFORMANCE REQUIREMENTS
During
the three years of TIMS implementation, the data generators and the end-user of
the data—the LANL Dosimetry Program—have developed and refined specific technical,
performance, cost and quality data requirements. All LANL bioassay analytical work is done in accordance with a
detailed Project Management Plan that includes an Analytical Service Agreement,
Data Acceptance Criteria, Quality Assurance Project Plan, and detailed
analytical procedures [3]. These
documents contain the specific requirements for the products and services to be
provided to ensure that quality assured and sufficient data are reported to the
end-user. The LANL Analytical Bioassay
Program is also conducted in compliance with the requirements of the DOE
Laboratory Accreditation Program (DOELAP) [4].
Internal tracer recovery
Tracer recovery in radiochemical analysis methods is an important factor in achieving lower detection levels for the determination of plutonium. A plutonium-242 spike is added as an internal tracer to each urine sample, blank and quality control (QC) sample. Tracer recoveries, as established by the end-user of the data and determined by RAS, must fall between 40% and 110 % for RAS, and between 15% and 110% for TIMS. The percent tracer recovery results are tracked on a monthly basis as part of the overall bioassay quality assurance (QA) program. Samples that do not meet the tracer recovery requirements are re-collected from the individual being monitored, and re-analyzed (re-runs).
The tracer recovery performance has
improved dramatically over the past three years. In the first year of production TIMS analysis, the number of
re-runs was not tracked or evaluated.
However, complaints from individuals being monitored indicated that
numerous requests for resubmission of samples were occurring. In CY1998, re-runs were carefully tracked,
and reached an all-time high of 30% when a work-suspension was enacted on the
RAS portion of the plutonium bioassay program. The corrective actions resulting
from the work-suspension included a technician certification program that
required a dedicated technician for complete analysis of a sample set, allowing
personal accountability for the quality of each sample set. The certification program requires 3
consecutive, successful practice sets that have at least 8 of 10 samples with
acceptable tracer recovery through RAS.
To maintain certification, a technician must produce 2 of 3 consecutive
sample sets with at least 8 of 10 samples with acceptable tracer recovery. Since implementation of the corrective
actions, re-runs for unacceptable tracer recovery for RAS are ~5%. Although RAS analysis has to be redone if
the tracer recovery is less than 40%, TIMS analysis may proceed if it is
greater than 15%. The number of TIMS
samples lost through failure to meet this metric is <1%.
Turn-around times
The Bioassay Program
has two categories for target turn-around-times for analysis and reporting results:
priority and routine. Samples designated for TIMS analysis are initially
analyzed by RAS to determine the plutonium-238 and -239 values, to screen for
elevated levels of plutonium, and to determine the tracer recovery. Urine samples designated for priority
plutonium analysis require RAS results to be reported within 8 working days and
TIMS results within 10 days. Urine
samples designated for routine plutonium analysis require RAS results to be
reported within 25 working days and TIMS results within 35 days. Establishing
realistic target turn-around-times for sample analysis has required iterative
integration between the generators and the end-users of the data. The need for obtaining analytical data in a
timely fashion must be balanced with the historical routine performance of the
RAS and TIMS operations of sample receipt, login, preparation, analysis and
data reporting.
Achievement of TIMS
turn-around times is totally dependent on the RAS portion of the program. In CY1998 TIMS met turn-around times 79%; in
1999 25%; and to date in 2000 90%. The
work-suspension in late CY1998 created a significant backlog in RAS that
impacted TIMS turn-around times in CY1999 accordingly. In response to exposure accidents, sample
analyses have been completed through both RAS and TIMS in five days with
dedicated staff working 10-hour days solely on those samples.
Throughput
Production
capability of the existing TIMS chemistry operation is 12 samples/week, which
is adequate to meet current in-house sample load. Increasing chemistry staff can easily accommodate additional
sample load. Analysis by TIMS with one instrument can handle up to 24
samples/week. Samples analyzed in the
three years of operation have averaged about 300/year for routine turn-around,
and 20-50 for priority, well below capacity.
The
TIMS facility houses three identical NBS 12-90 TIMS units, one of which is
dedicated to bioassay analyses. The
DOELAP requires back-up capability, and the availability of the other two
instruments allows full back-up to support the Bioassay Program. Currently, a significant electronics upgrade
is being performed on all of the TIMS units.
Additionally, one unit is being modified and the necessary software
developed to fully automate the analysis of bioassay plutonium samples by
TIMS. Full automation will allow the
technician to simply load the samples into the turret, and let the computer run
the analysis with no operator attention.
Automation will reduce labor costs for sample analysis by ~40%, and will
increase throughput efficiency by 50%.
Additionally, consistency between samples and background levels should
be improved by minimizing variation introduced by human operators. A second TIMS system will be automated in
the future to provide full back-up capability.
Performance Evaluation (PE) Samples
The internal QA program requires the incorporation and analysis of QC samples including blanks and single blind QC samples at a 5% level in the sample batches. These QC samples are incorporated into the analysis batch during login and are processed concurrently with the sample batch. Duplicate samples are not analyzed due to volume limitations. The LANL Bioassay Program has established operational control limits for acceptability of tracer recovery for RAS and TIMS, +/- the Minimum Detectable Activity (MDA) for the blank, and +/- 25% for the bias on single-blind QC samples spiked at >10X the MDA. The percent bias performance of plutonium-239 blind QC samples, spiked at > 10X MDA, and analyzed by TIMS from September 1998 through February 2000 is shown in Figure 1.
Early data show a distinct positive bias, partially resulting from a slight body burden of plutonium in the individual donating urine for preparation of the QC samples, which was not observed at RAS analysis levels. This situation was remedied by establishing a controlled system to identify urine donors, certify their urine as clean, i.e., plutonium-free, through TIMS, and maintain an approved donor pool of about 15 people. The QC program requires 5-10 liters of “certified” urine per week for use as RAS/TIMS blanks and for the preparation of internal plutonium control samples.
Figure 2 compares the recent
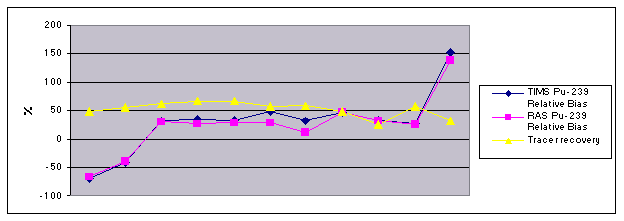
RAS and TIMS plutonium-239 QC sample percent bias results that were outside the
acceptance criteria, along with the plutonium-242 tracer recoveries. All tracer recoveries are well above the
required TIMS 15%, and in the typical range for other samples that are within
control. There appears to be no
correlation between tracer recoveries and percent bias. The percent bias between the RAS
plutonium-239 and TIMS plutonium-239 QC samples tracks very closely, which
indicates that there is no loss or contamination in the TIMS chemistry, or the
TIMS analysis. Potential areas for
further process improvement include modifications in the preparation of QC
samples and RAS process chemistry.
The LANL Bioassay Program analytical chemistry laboratories
participate in the Oak Ridge National Laboratory (ORNL) In-vitro Bioassay
Inter-comparison Study (natural urine); the National Institute for Standards
and Technology (NIST) Radiochemistry Inter-comparison Program (synthetic
urine); and DOELAP (synthetic urine).
Currently, there is no program that is capable of providing routine PE
samples at the aCi level for evaluation of TIMS at 10-20X MDA. The ORNL program currently provides routine
PE samples at the lowest levels available at the fCi level, which is ~60X MDA
for plutonium-239 by TIMS. LANL plans to participate in a second
inter-comparison study designed to evaluate and validate the capabilities of
TIMS in the determination of ultra-low-levels of plutonium in synthetic urine
at the aCi level. This study is being
coordinated by NIST and Duke Engineering and Services and is planned for CY
2000.
In CY1997, ORNL began
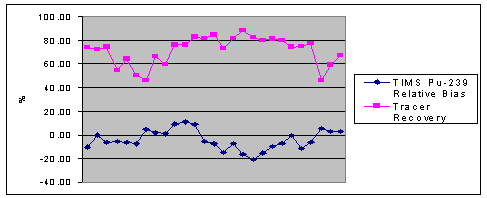
providing PE samples for the TIMS program. Results for plutonium-239 in urine
by TIMS have always met the –25% to +50% ANSI N13.30 [5] acceptance criteria
used by ORNL, as well as the more restrictive internal LANL values of +/-25%
relative bias are shown in Figure 3.
There does not appear to be any correlation between the levels of spike
in the samples and the performance of TIMS, as the spike levels range from 9
fCi/Kg up to 1,500 fCi/Kg. Each set
includes more than one spike level. Precision
and bias seem to be more dependent over time with changes in the RAS processing
and changes in analysts. The ORNL PE
samples have proven to be an invaluable tool in assessing the performance of
TIMS, and identifying areas of opportunity for improvement within the program.
STATISTICAL DATA TREATMENT FOR TIMS
Initially, data treatment used a running average of a
set of data points instead of considering each data point individually. In FY98,
the software was modified to store each counting event and track it against
time and temperature, significantly changing the statistical approach to the
analysis of low-level TIMS data.
Basic principles
Count-rates for isotope masses of interest are measured
and the ratio of the isotope of interest to a known reference isotope is
determined. Ratio determination is
complicated because the count rate is not constant, and the single ion counting
channel does not allow the isotope of interest and the reference isotope to be
measured concurrently. Further
complications include background and isobar signal contributions that do not
originate from the isotopes of interest, and system noise that generates
occasional counts.
Once noise, background, and isobar signal contributions
are subtracted from the data, curve shapes of the count rate, as a function of
time (and temperature) will be identical. That is, ![]() , where
, where ![]() is the count-rate for
isotope i,
is the count-rate for
isotope i, ![]() is the count-rate for the reference isotope as a function of
time t and temperature T, and
is the count-rate for the reference isotope as a function of
time t and temperature T, and ![]() is the desired ratio between isotope i and the reference isotope. Noise is removed based on Chauvenet's criterion. Background subtractions are made based on an
average of the half-mass measured on both sides of the peak of interest. The isobar is identified and removed by
taking advantage of the fact that the isobar count rate follows a different
curve than that of the reference isotope.
is the desired ratio between isotope i and the reference isotope. Noise is removed based on Chauvenet's criterion. Background subtractions are made based on an
average of the half-mass measured on both sides of the peak of interest. The isobar is identified and removed by
taking advantage of the fact that the isobar count rate follows a different
curve than that of the reference isotope.
Isobar correction
The background corrected count-rate data for
the isotope i is fitted to a function
of the form ![]() . The desired isotope
ratio between the isotope i and the
reference isotope is given by
. The desired isotope
ratio between the isotope i and the
reference isotope is given by ![]() . The count-rate
function for isotope i is given by
. The count-rate
function for isotope i is given by ![]() , which corresponds to the desired condition noted earlier
stating that the isotope and reference have the same time-temperature function
shaped curves. The count rate curve for
the isobar is given by
, which corresponds to the desired condition noted earlier
stating that the isotope and reference have the same time-temperature function
shaped curves. The count rate curve for
the isobar is given by ![]() , such that the isobar decays to zero at infinite time. This
model generally describes the data quite well.
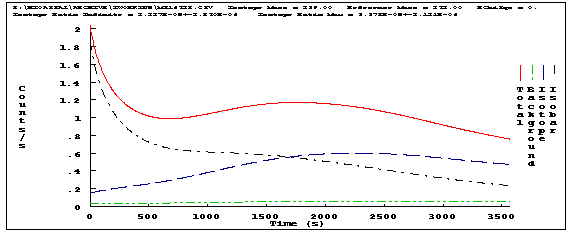
Figure 4 shows the background, isobar, and isotope counts components.
, such that the isobar decays to zero at infinite time. This
model generally describes the data quite well.
Figure 4 shows the background, isobar, and isotope counts components.
Further work
The present method of data reduction
is only applicable to data where the background and isobar contributions are
small relative to the uncertainty in the count-rate of the reference
isotope. This limitation is being
addressed in an ongoing effort by applying the background and isobar model to
the reference data and by fitting all the data simultaneously.
The functional form of the isobar model is also being
refined. There is evidence that there
is a component of the isobar that is not proportional to the reference curve,
which is not presently accounted for.
Much of the blank appears to be a residual isobar that cannot be
subtracted at the present time, but could likely be reduced with an improved
isobar model.
Minimum detectable activity
Chemical yield appears to be the most important factor
in determining MDAs. Since the MDA is
based on the variability of blank data, low chemical yield¾which
results in low count rates¾leads to higher MDAs due to lower precision and more
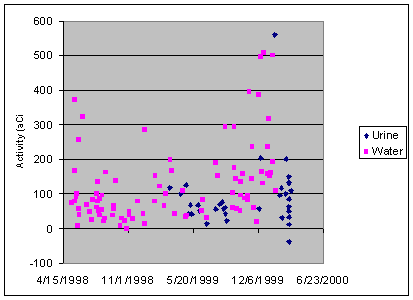
variable blank measurements. Figure 5
shows plutonium-239 process blanks as a function of date and matrix.
For the first year water blanks were used. For the past year both water and urine
blanks were used, and currently all blanks are TIMS certified, clean
urine. Urine blanks yield significantly
lower blanks, apparently due to better chemical yield.
LESSONS LEARNED
Sophisticated process chemistry
Although only a fraction
of the urine samples analyzed for plutonium eventually go through TIMS, it is
essential that the chemistry used is sufficiently clean to meet the sensitivity
requirements for TIMS, such that any sample analyzed by RAS can be further
processed for TIMS if required. The
chemistry used must be sufficiently robust and efficient to be applied to
~2,000 samples a year for alpha-spectroscopy, of which 300-400 go on for TIMS
analysis.
Techniques commonly used for
RAS analysis were not suitable for the more sensitive TIMS analysis. Practices that are perfectly acceptable for
RAS can cause detectable sample contamination when used to process TIMS
samples. All operating procedures had to be re-evaluated to ensure
compatibility with the more sensitive measurement technique. Processing of samples has to be conducted in
Class-100 clean-rooms to support the sensitivity of TIMS. Although conducted in a clean-room facility,
the rooms, equipment and reagents used by the bioassay program have to be
"blanked" prior to use, to ensure that there are no programs in the
area that could negatively affect the bioassay results.
Culture change
Transition to a routine
production environment required implementation of a much more rigorous
formality of operations than was originally used during the research and
development phase of the TIMS program.
It took two years of operation to fully develop operating procedures and
protocols acceptable to the chemists, TIMS analysts, and QA staff. Once the analytical procedures were in
place, a significant culture change was required to accept and implement the
rigor and consistency imposed by the QA program.
Attention to detail
The RAS chemistry developed for TIMS is much more sensitive to analyst technique and attention to detail. A tracking system was developed to monitor the performance of analysts. As the formality of operations has increased, the program has become more rigorous and demanding, and while personnel turnover is minimal, periodic re-training and process refreshers are essential to maintain proficiency.
Equipment
Most equipment is used only once to minimize the
potential for cross-contamination.
However, some equipment is simply too expensive to be single-use, e.g.
the 2 liter Teflon®
bottles that are used to precipitate the plutonium from urine. Early on, the bottles were carefully
cleaned and re-used at random. The
processing of high-level QC samples (some over 10,000 times above TIMS limits
of detection) resulted in contamination of samples at levels above the TIMS
limits of detection and may have caused false positive results to be reported
during the first year TIMS analyses were performed. This contamination was not identified until sufficient TIMS data
were available. To solve the contamination problem, levels of plutonium in the
QC samples were reduced, and a strict protocol for Teflon® bottle re-use was
implemented. The containers used for
QC samples are segregated and re-used only for other QC samples, and not used
for customer samples. Additionally, the
Teflon®
bottles are not re-used in incident response situations where elevated-levels
of plutonium in urine are suspected.
Throughput
A culture change was also required to move from success on one set of samples to success for every set of samples on a continuing daily basis. The primary reason for sample loss is tracer recovery¾generally a result of error in technique, inattention to detail, and occasionally matrix problems. Physical sample losses, e.g., spilling, dropping, mix-ups, etc., are rare.
Samples from the
routine program are rigorously scheduled, with negotiated sample loads and
turn-around times. In incident response
situations, an additional sample load of priority samples with faster
turn-around times severely impacts the routine program. Parallel systems were developed to provide
sufficient resources to maintain the routine program, while meeting deadlines
for priority samples.
CONCLUSIONS
Transition of an in-house research tool to a production analytical process has provided a fertile area for application of formality of operations and project management practices. Continuous improvements in efficiency and the quality of product include: increasing the plutonium ionization efficiency to increase sensitivity and lower blanks; improving the stability of the TIMS instruments through electronics upgrades and automation: developing more sophisticated data reduction and background correction routines; and maintaining a rigorous QC program to monitor ongoing TIMS analytical quality.
REFERENCES
1. United States of America, Code of Federal
Regulations, 10 CFR 835.402(b).
2. W.C.
Inkret, et al, International Journal of Mass Spectrometry, 178 (1998)
113-120.
3. Los Alamos National Laboratory Analytical Bioassay Project Management Plan, LA-UR-99-4817, February 2000.
4.
The
U.S. Department of Energy Laboratory Accreditation Program for Radiobioassay,
DOE-STD-1112-98, December 1998.
5. American
National Standard, Health Physics Society, Performance Criteria for
Radiobioassay, HPS N13.30-1996.

FIGURES

Figure 1: Results of
Pu-239 TIMS Blind QC samples spiked at >10X MDA, September 1998 through
February 20000.
Figure 2: RAS and TIMS Pu-239 QC results that exceed +/- 25% relative bias, September 1999 through February 2000.

Figure 3: TIMS analysis of ORNL PE samples spiked with Pu-239, January 1997 through December 1999.

Figure 4: Components of the fit to the 239-plutonium counts.

Figure 5: Plutonium-239 process blanks as a function of date and sample matrix