INTRODUCTION
The Atomic Energy Control Board is
in the process of promulgating new Canadian regulations for workers that are
exposed to radioactive materials. This change will result in a dose limit of 100 mSv in a five-year period with a
maximum of 50 mSv in any one year. For
planning purposes an average of 20 mSv per year is often used. These new, and lower, limits will mean that lung
counting for Canadian workers exposed to separated insoluble (type M or S)
natural uranium will no longer detect an intake until after the individual has
exceeded the dose limit.
As
previously shown (Kramer et al. 1999), the counting efficiency of a lung
counter is dependent on the chest wall thickness of the subject. The average chest wall thickness of the
Cameco workforce was found to be approximately 3.8 cm. The minimum detectable activity expected for
a subject with this chest wall thickness was shown to be about 8 mg for a lung counter consisting of either a
four phoswich detector array or a four germanium detector array. Depending on the intake time, this lung burden
corresponds to an exposure that will result in a dose equal to or twice the impending
dose limit if the average of 20 mSv is assumed.
The
role of the lung counter for monitoring workers exposed to separated natural
uranium is now in question and its value in routine monitoring appears to have
been degraded. To assess how lung counting
may fit into Cameco’s radiation protection program a joint measurement program
between Health Canada’s Human
Monitoring Laboratory (HML), which operates the National Calibration Reference
Centre for In Vivo Monitoring (Kramer
and Limson-Zamora 1994), and Cameco was initiated. The two facilities collaborated to make lung counting
measurements on seven employees as described below. It was expected that five of the employees may have had small
measurable lung burdens as they worked with insoluble UO2.
Although
the investigation described in this paper uses both the 63 keV and 185 keV
photons from natural uranium, Cameco (and similar facilities) can only use the
185 keV photons for lung counting as the company manufactures separated natural
uranium. The daughter products are
removed during the process and cannot be assumed to be in equilibrium.
METHODS AND MATERIALS
The
seven subjects were lung counted first at the HML using a germanium detector
lung counter and then again the following day at Cameco using a phoswich
detector lung counter. Four more
subjects were counted at the HML at a subsequent time. The counting time was lengthened from the
usual 1,800 seconds to 3,600 seconds to improve sensitivity at both sites. Any observable activity was assumed to be
due to Type S UO2 as the Cameco plant had been shut down for the
month immediately prior to the lung count being performed. The lung counting systems at the HML and
Cameco have been described in detail elsewhere (Kramer et al. 1998)
Analysis
of the results using the HML’s software did not detect any significant levels
of activity in any of the seven subjects so a more in-depth analysis was
performed manually. The spectra were
exported to text files and imported into Microsoft Excel. The spectra for each individual were summed
and plotted. Two regions were selected:
62 - 65 keV and 184.5 - 187 keV. The
counting data was copied to Jandel’s TableCurve and a Gaussian curve imposed
onto the data.
The
analysis of the counting data at the Cameco site was completely different. The analysis software, WBC-ELD version
1.0-512 (whole body count - Eldorado), supplied by Radiation Management
Corporation. RMC was absorbed by
Canberra Industries in 1995. The
software uses the spectral shapes of phoswich spectra obtained from 234
Th, 235U, 137Cs, 40K, and 226Ra
standards measured in the LLNL phantom (with and without overlay plates) to
obtain a theoretical fit to the observed spectrum using a non-linear least
squares fit (Householder’s technique).
A
different approach to analysing this data was taken by collecting a standard
spectrum using the LLNL torso phantom with the B4 overlay plate and a lung set
containing 701 mg of natural uranium.
This spectrum was also exported to Microsoft Excel. The counts were normalised to 1 mg. Multiples of this spectrum were then added
to each of the seven subjects’ spectra to simulate an extra 5, 10, 15, 20, 25,
30, 35, and 40 mg. These spectra were
analysed as above. Linear regression
was performed on the results with the intercept (at added amount equal to zero)
was taken as the lung burden of the subject.
To
confirm the validity of this approach two other experiments were
performed. The first was using the LLNL
torso phantom containing small amount of natural uranium in the form of
pellets. The pellets were placed in a
blank lung set that contained holes to attempt to simulate a homogeneous
distribution. The activities used were
in the range of 0.96 to 4.11 mg natural uranium. The B4 overlay was used to
give an average chest wall thickness of 3.83 cm to better match the chest wall
thickness of the Cameco workforce. The
same analysis procedure as above was applied to the counting data.
Unfortunately,
the results are confounded by the small, but significant, contamination of the
HML’s LLNL phantom with low enriched uranium.
This limitation was mitigated by counting the phantom for a long period
and estimating the equivalent amount of U-nat present. This was then applied as a correction to the
results obtained from the standard addition technique.
As
the addition of multiples of the normalised standard spectrum to either a
subject’s spectrum or the pellet spectrum resulted in an excellent straight
line so it was not possible to get an estimate of the uncertainty of the
intercept that expressed a meaningful uncertainty on the lung burden. This issue was solved by using a Monte Carlo
simulation contained in Decisioneering’s Crystal Ball version 4.0c. A spreadsheet was created that simulated the
photopeak count rate corresponding to each of the spectra that had multiples of the normalised standard added. The count rate corresponding to zero mg
added was assigned to a Poisson distribution and the forecast was assigned to
the intercept of the linear regression.
The range of intercept values that fell in the 95% confidence interval
were taken to represent the mean " 2F.
Another
technique of spectral addition was applied to the eleven spectra obtained from
the Cameco employees. This addition of
the spectra was possible as the HML’s Ge detectors are very stable. The energy calibration remains constant over
long periods of time.
RESULTS AND DISCUSSION
Normal Analysis: The results of counting the seven
subjects at the HML and Cameco sites is
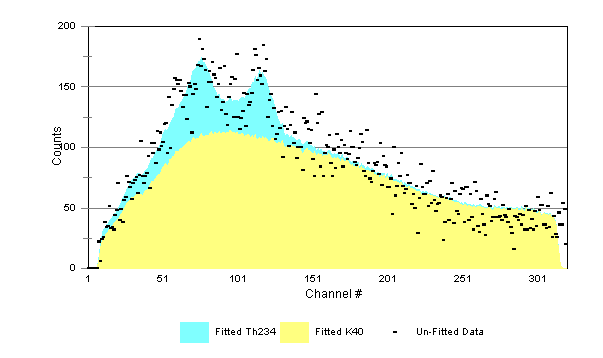
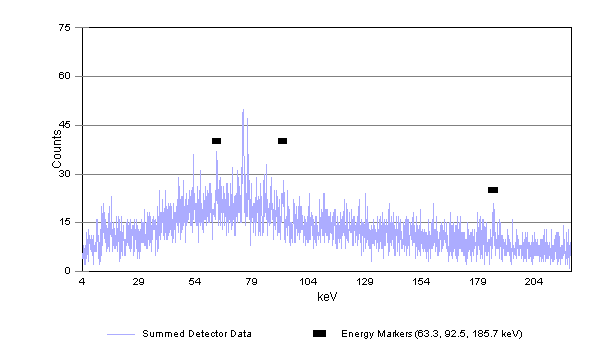
shown in Table 1. A typical spectrum is
shown in Figs. 1 - 2. Fig. 2 has
markers that indicate the expected position of photopeaks from 234
Th and 235U. It also shows
two prominent peaks at around 75 keV.
These are Pb fluorescence x rays emitted from the walls of the HML’s low
background counting chamber and not from the subject.
The
spectra collected at the HML were analysed for both the 63 keV and the 185 keV
photons emitted from natural uranium.
In most cases the subjects were below both the decision level and the
minimum detectable activity. Only GJ
and PC exceed the decision level for natural uranium measured from the 63 keV
and 185 keV photons, respectively. All the other individuals would be declared
“clean”. The results from the HML and
Cameco using this technique are in general agreement with those obtained using
the normal method of analysis.
At
the Cameco site, GJ, PC, RR, and LN exceed the minimum detectable activity for
natural uranium measured from the 63 keV photons, but none of the subjects
exceed the minimum detectable activity for natural uranium measured from the
185 keV photons. However, GJ, RR, and
LN do exceed the decision level. The
measurements made using the 185 keV photons are the ones that must be used by
Cameco as the 234 Th daughters cannot be assumed to be in
equilibrium with the parent nuclide.
Interestingly,
the results at the Cameco site are all higher than those measured at the
HML. This may be due to the very
different nature of the analysis methods between the two facilities. The HML normally analyses the spectrum
assuming that nothing is present unless clearly seen i.e., a peak search
technique. In this case however,
analysis was forced assuming that the counts in the 63 keV and 185 keV regions
of interest were elevated and contained a contribution above a flat background
from a small amount of natural uranium in the lungs. Cameco analyses a spectrum assuming that natural uranium, 40K,
137Cs, and background are responsible for the spectrum’s shape and
then fits the shape of the subject’s spectrum to a combination of stored
standard spectra. The agreement between
the two sites, where data exist, is between a factor of 1.02 and 2.45.
Standard Addition: In an effort to better determine the
amount of natural uranium that might be in the lung a standard addition technique was developed. Portions of a natural uranium spectrum were
added to each subject’s spectrum.
Analysis of these simulated spectra gave simulated lung burdens. The measured lung burden was plotted against
the amount added and the plot extrapolated back to zero added. This was the value taken to be the lung
burden present in the subject. All of
these plots yield very straight lines that have a correlation coefficient
greater than 0.99. This is simply due
to a methodology that adds multiples of a constant amount of signal to the
subject’s spectrum. It means however,
that the errors on the intercept obtained from the linear regression of this
data are not meaningful and do not represent the uncertainty on this value.
The
results from the addition of multiples of the normalised standard spectrum
indicated that this was not a useful technique and further work was halted.
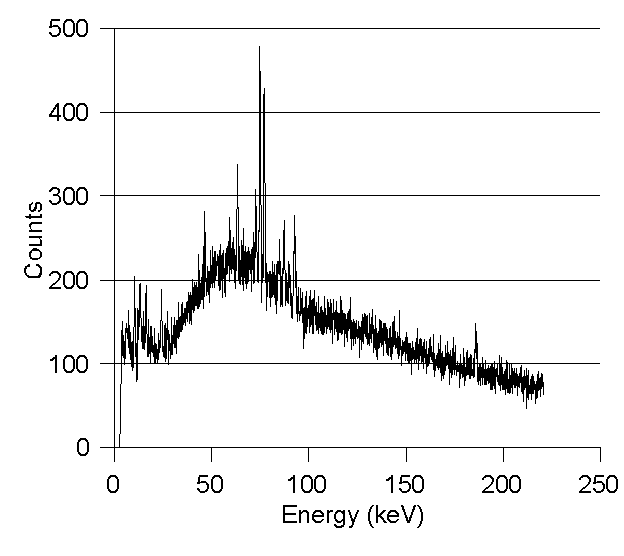
Spectral Addition: The composite
spectrum of a Cameco employee who underwent 10 sequential lung counts for a
total of 10 hours is shown in Fig. 3.
Comparing Figs. 2 and 3 one can see that the 235U photopeak
(186 keV) has become clearly visible
above background. Analysing Fig.3 using
a chest wall thickness representative of the group of employees one obtains a
lung burden of 4.00 mg. This is well
above the MDA of 2.5 mg for this count.
Increasing
the counting time from 30 minutes will give increased sensitivity. For example, the expected decreases in MDA
as the counting time is increased from 30 minutes by factors of 2, 4, 8, 16,
and 20 are factors of 1.4, 2, 2.8, 4, and 4.5 respectively.
This
finding opens up two possibilities:
Group monitoring and summed individual monitoring.
In the former case, a group of
employees can be counted for one hour each. Their spectra can be summed and
analysed for 235U. Failure
to detect an 235U lung burden in the composite spectrum will mean
that none of the employees has a significant lung burden above their individual
decision levels. This method suffers
from the fact that one or two persons may have a small burden that could be
diluted by the other components in the spectrum. This method will work well if all the workers are assumed to be
equally exposed and all are expected to have similar lung burdens. If a measurable amount of 235U is
found in the composite spectrum it can be analysed using an chest wall
thickness that is the average of the group and an equal amount assigned to each
person.
A
more powerful technique would be to measure the same individual sequentially
over a period of days and sum those spectra.
Naturally, it is assumed that during this monitoring period the employee
is not potentially exposed. This
technique has the advantages of not averaging activity over a group of workers,
using the person specific calibration data to assess lung burden, and
dramatically reducing the MDA for that person
CONCLUSIONS
Investigating
below the MDA is imprecise as the statistics of a random process cannot be
avoided. However, the use of the
standard addition seems to have merit in distinguishing between uncontaminated
and slightly contaminated individuals.
Unfortunately, the technique does not provide uncertainty values of the
activity estimate. Further work was halted as results suggested that the technique
was unreliable.
The
spectral addition technique offers more advantages. It can be applied to a group of workers or to an individual who
is repeatedly monitored over a period of a few days. In the former case it is most useful if no 235U is
detected and in the latter case if greatly increases measurement
sensitivity. The spectral addition
techniques can reduce the MDA by about a factor of about 4.5 from the normal 30
minute counting time currently used at Cameco
REFERENCES
Brodsky, A. Accuracy and detection limits for bioassay measurements in radiation protection. Washington D.C.: US Nuclear Regulatory Commission. Report NUREG-1156; 1986.
Kramer, G.H.; Limson Zamora, M. The
Canadian National Calibration Reference Centre for Bioassay and In-Vivo
Monitoring: A Program Summary. Health Phys. 67(2): 192-196; 1994.
Kramer G.H.; Hauck, B.M.; Allen, S.A. Comparison
of the LLNL and JAERI torso phantoms using Ge detectors and phoswich detectors. Health Phys. 74(5):594-601; 1998.
Kramer, G.H.; Hauck, B.M; Allen, S.A. Chest Wall Thickness measurements and the
dosimetric implications for workers in the Uranium Industry. Health Phys. (Submitted 1999).
Palmer, H.E.; Rieksts, G.A; Jefferies, S.J.;
Gunston, K.J. Improved counting efficiencies for measuring 239Pu in the
lung in the sitting position. Health
Phys. 57(5): 747-752; 1989.
Summerling, T.J.; Quant, S.P. Measurements
of the human anterior chest wall by ultrasound and estimates of chest wall
thickness for use in determination of transuranic nuclides in the lung. Rad. Prot. Dosim. 3(4): 203-210; 1982.
Vickers, L.R. The gender specific chest wall thickness
prediction equations for routine measurements of 239Pu and 241Am
within the lungs using HPGe detectors.
Health Phys. 70(3): 346-357; 1996.
Table 1: Measured lung burdens of the
subjects and the decision level, LC , and minimum detectable
activities, MDA, for those subjects using the 63 and 185 keV photons at the HML
and Cameco sites. N/A denotes no
analysis possible.
|
|
HML |
|
Cameco |
||||
|
Subject |
LC (mg) |
MDA (mg) |
Found (mg) |
|
LC (mg) |
MDA (mg) |
Found (mg) |
|
|
|||||||
|
63 keV |
|||||||
|
SA |
4.9 |
9.9 |
N/A |
|
1.9 |
5.3 |
N/A |
|
GJ |
3.7 |
7.3 |
3.9 |
|
1.9 |
3.7 |
4.0 |
|
RF |
5.1 |
10.3 |
2.0 |
|
2.8 |
5.5 |
4.9 |
|
PC |
3.8 |
7.5 |
3.1 |
|
1.9 |
3.9 |
6.0 |
|
RR |
4.0 |
8.0 |
2.5 |
|
2.1 |
4.2 |
6.0 |
|
LN |
3.9 |
7.8 |
3.3 |
|
2.0 |
4.0 |
6.4 |
|
SP |
3.1 |
6.2 |
N/A |
|
1.5 |
3.0 |
1.3 |
|
TB |
4.5 |
9.0 |
4.3 |
|
0.8 |
1.5 |
|
|
LT |
3.4 |
6.8 |
0.9 |
|
0.7 |
1.4 |
|
|
CW |
5.7 |
11.5 |
2.3 |
|
0.9 |
1.7 |
|
|
SM |
3.5 |
7.0 |
1.4 |
|
0.7 |
1.4 |
|
|
|
|
|
|||||
|
185 keV |
|
|
|||||
|
SA |
5.6 |
11.2 |
N/A |
|
4.1 |
8.3 |
N/A |
|
GJ |
4.4 |
8.7 |
2.2 |
|
2.9 |
5.9 |
3.5 |
|
RF |
5.8 |
11.6 |
N/A |
|
4.3 |
8.6 |
2.2 |
|
PC |
4.5 |
8.9 |
5.0 |
|
3.0 |
6.0 |
N/A |
|
RR |
4.7 |
9.4 |
4.1 |
|
3.3 |
6.6 |
4.5 |
|
LN |
4.6 |
9.2 |
N/A |
|
3.2 |
6.3 |
4.5 |
|
SP |
3.7 |
7.4 |
N/A |
|
2.4 |
4.7 |
N/A |
|
TB |
5.2 |
10.3 |
3.9 |
|
2.9 |
5.7 |
|
|
LT |
4.1 |
8.2 |
1.7 |
|
2.4 |
4.8 |
|
|
CW |
6.3 |
12.6 |
3.6 |
|
3.7 |
6.7 |
|
|
SM |
4.2 |
8.4 |
2.3 |
|
2.5 |
5.0 |
|
|
|
|
1 Subject PC measured in Cameco’s Phoswich lung counter |
|
|
|
2 Subject PC measured in HML’s Germanium lung counter. |
3: Summed spectra of a Cameco employee
simulating an 10 hour count.
|
|


