Laboratory Data and Information Technology

Kenneth V Miller, STL Richland, v1.7


Introduction


This topic developed from observing the failure of four Laboratory Information Management Systems (LIMS) development projects by four difference corporations.  In brief, the software development failures were due to the complexity of the product, the overwhelming effort required, and the instability in the analytical laboratory market place.  Laboratories are not in the business to write software, but in today’s environment it is impossible to stay in business without automated systems.  The instrument and LIMS software vendors only provide partial solutions.  The complete solution is for the laboratories to take control, understand what it is they are trying to do, and commit sustainable resources to software enhancements. 


Classification of Laboratory Data


The classification of laboratory data provides insight into the type of software needed, the experts who understand the underlying concept of the data, and the attributes of the software needed to manage the data.   Table I illustrates the classification of laboratory data and the attributes critical to the software development.


Table I. Classification of Laboratory Data

Attributes


Classification       Scale: 0 None, 1 Low to 5 High

Specificity to Laboratory Business

Data Manipulation

/Interpretation


Laboratory Dependencies

Experts Who Uunderstand Concepts

Management

Client/Project Specifications

1-Low

0-None

1

Lab


Reporting Requirements

1

0

1

Lab


Validation Requirements

1

0

1

Lab


Sample Status Information

1

1

1

Corp./Lab


Scheduling Information

1

2

2

Corp./Lab


Invoicing Information

1

2

1

Corp./Lab


Reportable Data

Final Results

1

1

1

Work Group


Batch/Method QC

5

4

4

Work Group


Client Supplied Data

1

1

1

Lab


Performance indicators

3

3

3

Lab


QC Limits

3

3

3

Lab


Selected Instrument Data

5

3

4

Work Group


Validation Data

Batch/Method QC

5

4

4

Work Group


Instrument QC

5

4

4

Work Group


QC Limits


Lab


Instrument Data

Channel Data

5-High

5

5

Work Group


Integrated Data

5

5

5

Work Group


Calibration Data

5

5

5

Work Group


Check/Background Data

5

5

5

Work Group


Raw Data Calculations

Final Results and Uncertainty

5

5

5

A few Individuals


Specificity to Laboratory Business – Is the data specific to the laboratory business or do the concepts apply to other businesses.

Data Manipulation/Interpretation – Is the data derived or a significant degree of interpretation required or just an attribute of some object.

Laboratory Dependencies – Is the data likely to be dependent on a particular lab or is it similar in all RAD labs.

Experts who understand the concepts – The domain experts, those who understand the underlying concepts of deriving, evaluating, and/or analyzing the data.

Work Group – A small group of laboratory associates having common tasks, often they are in the same department.

Table I suggests that the management data should lend itself to relatively “simple” generic software development even by developers not familiar with the laboratory business.  As we move down the table, there are fewer problem domain experts, and there is a high degree of laboratory dependence on how the data are derived and interpreted that make generic software development much more challenging.  With the expansive scope of a LIMS, the software task is simplified by considering the most important attributes of a LIMS that help run the laboratory.


Critical LIMS Attributes


The LIMS is involved in most day to day activities to the point where the LIMS becomes the business model.  The LIMS will dictate how the business functions.  It is critical the LIMS possess three attributes to be successful in the laboratory.


1.       Centralized Data

ü        The data must be accessible where it is needed.

ü        The centralization can be conceptual (logical).  That is, the centralization does not have to be physical.

ü        The data should include instrument data needed for evaluation and reporting.

2.       Usability

ü        The software must be somewhat intuitive.

ü        Determined to a large part by the user interface, i.e., screen presentations and reports.

ü        Adopting a MS Windows “standard” interface goes a long way to making the software intuitive.

3.       Extensibility

ü        The LIMS must accommodate extensions.

ü        Must allow for the addition of object attributes.

ü        The laboratory must be able to add middle-ware that works with the LIMS.


There are many more attributes that could be listed but these are the fundamental attributes that should be the starting point for any useful LIMS.  The approach to software development in the laboratory must be carefully considered.


Development Models


Commercial LIMSIf the business model can accommodate the changes needed to use a commercial LIMS then this is a good option.  For many laboratories, this option may be sufficient.


Customized Commercial LIMSA commercial LIMS with a limited amount of customization to accommodate the laboratory business model and/or to extend the functionality is often the best solution.  This assumes that the vendor starts with an established product and makes some modification that the vendor supports.


Corporate Developed LIMSWith enough resources and time this approach can take a laboratory’s business model and make it the basis for the LIMS.  Experience suggests that corporate written LIMS that try to do everything:

ü        Are often incomplete.

ü        Have a good chance they will never be fully implemented.

ü        Often fail to meet the needs in one or more areas within the laboratory.

ü        Frequently cause the fragmentation of software and data to occur spontaneously and immediately as a result of the previous three items.


These limitations are not due to the designer’s failure to understand the requirements or their technical abilities, but due to the difficulties and resources needed to transform the requirements into a useable product.  A corporate LIMS should concentrate on selected areas and not try to do everything for the laboratory.


Heterogeneous (Hybrid) LIMSIn many cases a hybrid LIMS can accommodate the laboratory needs.  This involves fusing together a commercial or corporate LIMS with laboratory written software components.  The laboratory written software will be referred to as middle-ware.  Table I suggests the following segregation of efforts.


1.       Corporate (Central) Team or Commercial LIMS can adequately handle the management data and related information including, Client, Projects, Test/Method Definition, Batching, Revenue, and Invoicing.

2.      
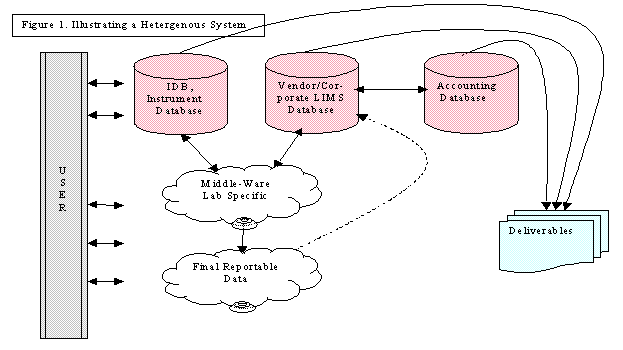
Laboratory Supported software should concentrate on what the laboratory knows best, the laboratory generated data.   This includes laboratory instrument data (the software is often supplied by another vendor), data manipulation software, EDDs, and anything else related to generating laboratory data.


Recommended Approach, Ignoring any Constraints


1.       Purchase a Commercial LIMS with the following attributes:

ü        Based on a major database (Oracle, Microsoft SQL Server Database (MSSQL) v7.0+).

ü        Written in an established programming language.

ü        Conceptually similar to the laboratory business model.

ü        Can be modified and “easily” extended.

ü        Has PC Connectivity.

2.       Implement the LIMS with vendor support that includes some customization.

3.       After 6 to 12 months start modifying/extending the LIMS to meet the laboratory’s exact needs, which may include:

ü        Instrument Database (IDB) that may require some LIMS vendor support.

ü        Data validation package.

ü        Table Driven EDD generator.

ü        Integrate all components.


It is critical for the laboratory to have a local expert who has some involvement in writing software. If the users don’t have a local expert to help figure out how best to use the system, they will often use inefficient paths to solve a particular problem.  This can lead to user written spreadsheets and software that will fragment the LIMS. That is, islands of data and software will exist within the laboratory.
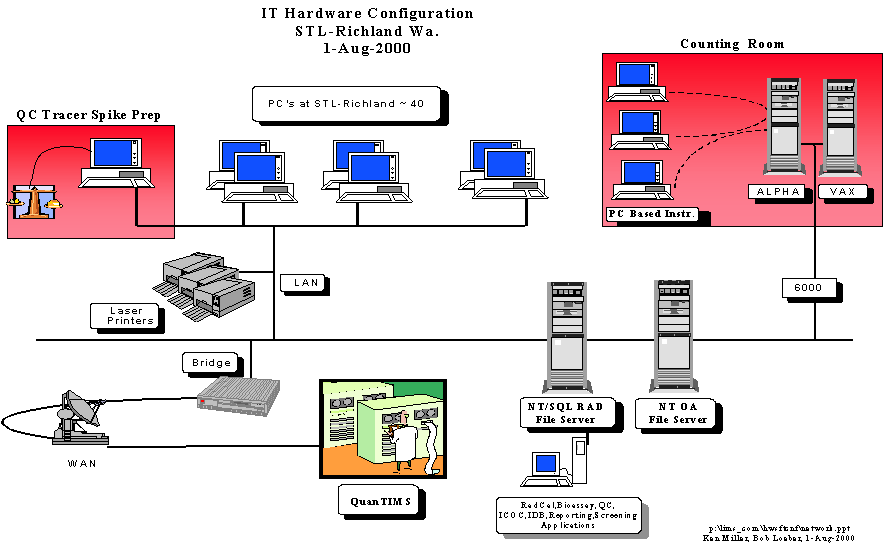
Case Study, STL Richland Hardware Configuration


STL Richland IT Infrastructure is shown in Figure 2 and contains components found in many corporate IT hardware configurations.


Case Study Cont., Software Components


STL Richland has a heterogeneous system comprised of a corporate LIMS (QuantIMS) and JDE Accounting Software running on an IBM As400. For the STL laboratories using the As400, it is the “STL” business model. The STL Richland Laboratory focal point for all data activities is a MSSQL v7.0 database that includes, mirrored data from QuantIMS, an Instrument Database, RAD Calculations, Data validation, and Reporting.

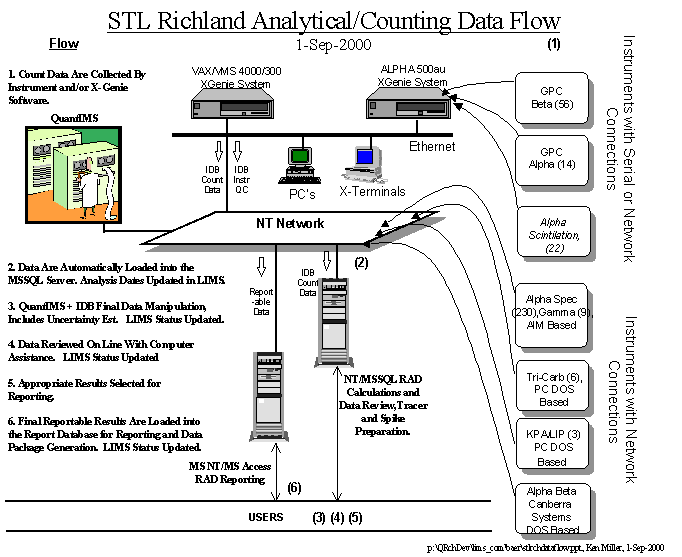
Text Box: Figure 3. STL Richland Data Flow


Case Study Cont., Radiological Calculations


RAD calculations and data validation are excellent examples of middle-ware, lab specific extensions to a LIMS. STL Richland developed the calculations to manage the multitude of data requirements of our clients.  A few of the requirements that are needed for the RAD calculations and data validations are:


1.    Reference any given equation for a project/method.  New equations are added frequently.  A few equations of interest are:

ü        Analyte Activity (Result).

ü        Count Uncertainty Estimate.

ü        Overall Analytical Result Uncertainty, Uc (Total Propagated Uncertainly).

ü        Decision Level (above which a sample analyte activity is positive).

ü        Detection Levels, MDA/MDC.

ü        Instrument Detection Limit (IDL).

ü        Analyte Recovery + Uncertainty (Bias)

ü        Precision, RER

2.    Demonstrate compliance to contractual and/or regulatory obligations.  A few of the issues of concern are:

ü        Can the lab meet the required MDA/MDC?

ü        Accuracy and Precision are within project tolerances.

ü        Absence of laboratory sample contamination.

ü        Instruments are in Control.

ü        The calculated uncertainties are reasonable.

ü        Method Blanks and Lab Control Sample are in control.

3.    Monitor total laboratory activity (in-house activity) and demonstrate the laboratory is within regulatory limits.

4.    Integrating the calculations with the preparation of standards used for tracers and spikes.

5.    Track all user data changes with audit trails.


A few items not related to the RAD calculations are also included in STL Richland’s middle-ware, i.e., Bioassay sample delivery and pickup since it is specific only to the Richland laboratory.


Case Study Cont., STL Richland’s Data Model/Flow


            The design of STL Richland’s middle-ware revolves around a MSSQL Server Database v7.0 that centralizes the data and makes it accessible from almost any computer software. The applications are written in Borland's Delphi, Microsoft Visual Basic, Microsoft Access, and Microsoft Basic for DOS only instruments and are all 2-tiered client server applications. The MSSQL database contains enough information to perform data quality review.  At this writing the Database does not contain channel data for alpha and gamma spectroscopy methods, but there is no reason why channel data could not be stored in the database.   The processing of channel data is interpreted as an instrument related activity. The instrument software, Canberra X-Genie, handles the manipulating and interpreting of channel data well.  STL Richland does not care to duplicate that effort.


            The instrument data are extracted from the instrument’s native data files by an appropriate program, i.e., Basic for Canberra configuration files, into a comma delimited text file.  Files that reside on a VAX or ALPHA computer are FTPed[1] to the MSSQL server PC about every ten minutes using a batch command procedure.  Networked PC instruments dump the data file directly to the MSSQL server PC when the count completes.  A MSSQL Database job automatically loads the data files and stores the count data/results in the appropriate database tables.  All counts, including re-counts of a particular sample/fraction, are loaded into the database.  A processing time stamp generated by the instrument distinguishes re-counts and re-processed count data.  After the data are loaded into the database tables, the count data and results are ready for processing and/or data review as appropriate.  


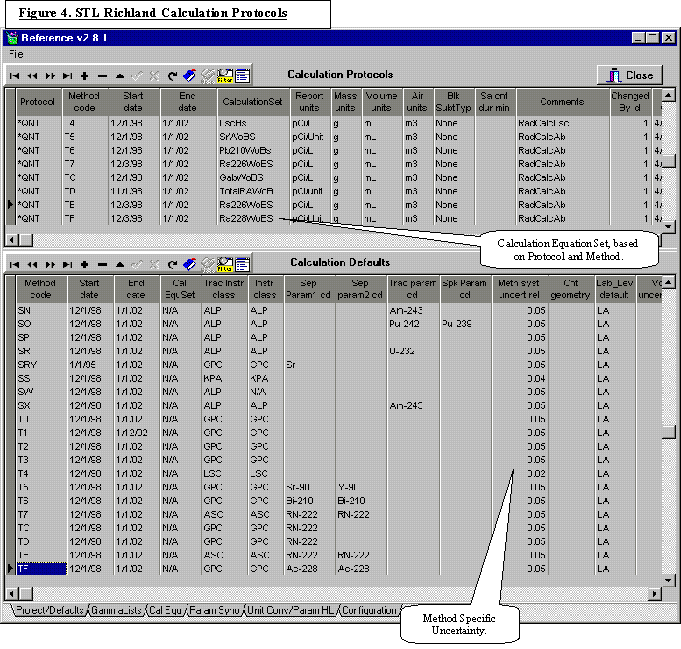
            The count data are merged with the appropriate LIMS data into a workspace for data processing since the instrument data and results are read only and cannot be changed!   As the data are merged, the appropriate calculation protocol is referenced based on the project and method.  The calculation protocol defines the equation set and other calculation specific information needed to process the count data into a final result and uncertainty.  A screen shot of the calculation protocols and defaults is shown in Figure 4.


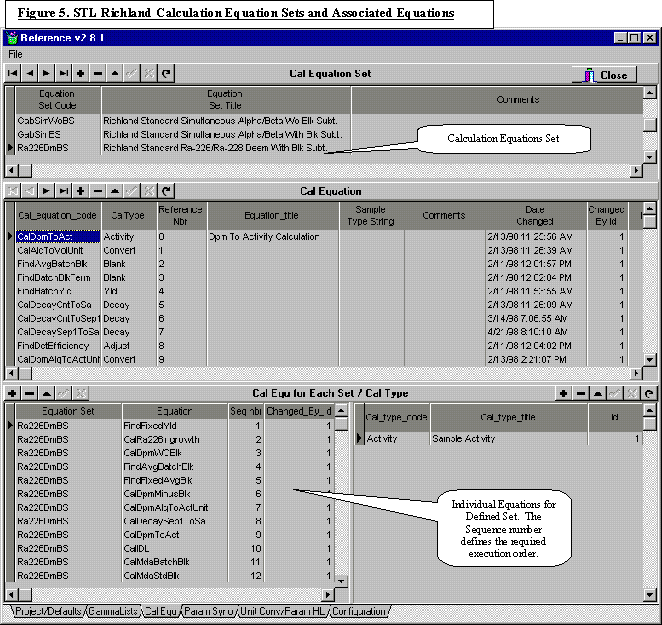
The equation set defines a set of calculation equations used to process the data.  At this writing, the equations are object methods within the application.  The original specification characterized the equations as user defined text equations.  We have found the current approach is very efficient and we have no plans to implement the user defined text equations.  An example equation set is shown in Figure 5.


The application of an equation set allows individual equations to be mixed and matched to define all steps necessary, including validation steps, to meet project requirements.


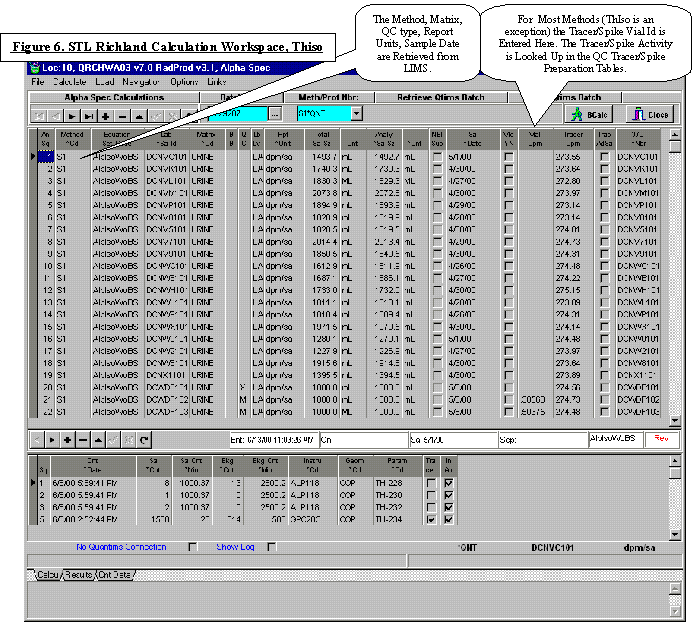
The count data, protocol data, calculation defaults, and selected LIMS data are merged into a workspace for data processing.  An example workspace for ThIso is shown inf Figure 6.  For this particular example, a beta tracer counted on a gas proportional counter, is merged with an alpha spectroscopy count.  The background count of the instrument region of interest (ROI) associated with the sample count ROI is loaded at the same time as the sample count.  The instrument tracks the association between sample count and appropriate background count.


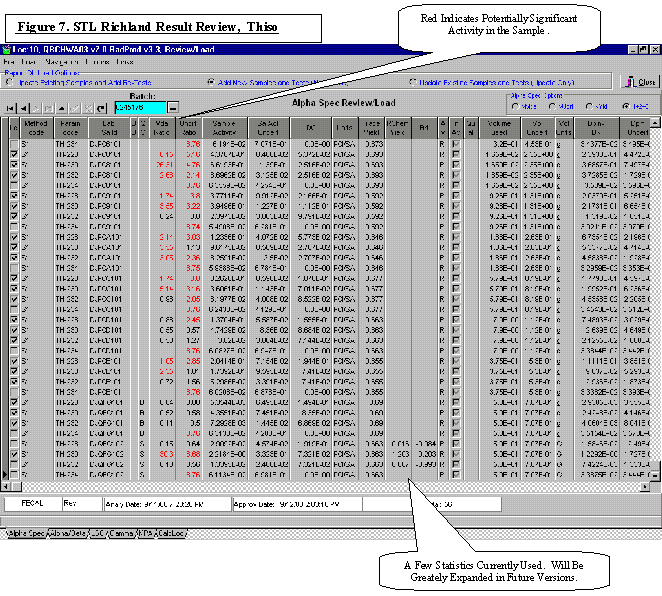
After the batch data are processed, the final results are independently reviewed.  The results are reviewed on line as shown in Figure 6.  The current version only performs a limited amount of data validation but the framework is in place to greatly expand the software validation.   Future versions will include the following statistics and validation checks.


1.       Method QC Limit Checks

ü        The method blank is checked to determine whether it is significantly different than the average of the previous twenty or more method blanks, μ + 2s and/or μ + 3s control limit.

ü        Whether the method blank is too negative. That is, the confidence interval, result + 2s, does not include zero.

ü        The LCS is checked to determine whether it is between the upper and lower project recovery limits.

ü        The matrix spike is checked to determine whether it is between the upper and lower project recovery limit.

ü        Whether the required method QC has been run as specified by the project.

2.       Precision Checks

ü        The matrix spike duplicate statistic, RER, is calculated to determine if the two results are significantly different.

ü        Sample duplicate static, RER, is calculated to determine if the two results are significantly different.  When the project requires RPD, the RPD is checked against a fixed project limit.  The project defines the required statistic, RPD or RER (two different RER equations).

3.       Individual Sample Checks

ü        Whether the Tracer Yield is within the project defined yield limits.

ü        Whether the appropriate instrument QC is in control when the sample is counted.

ü        Whether the instrument calibrations, when the sample is counted, is within the time period required by the project.


Case Study Cont., STL Richland’s Approach to Uncertainty Estimation


            STL Richland has approximately 50 counting methods and approximately 200 preparation/separation methods.  Trying to individually estimate the uncertainty associated with each of the procedures would be overwhelming and unmanageable for a routine commercial laboratory.  Therefore, we have looked for common sources of uncertainty associated with the preparation, separation, counting, and data analyses.  The common sources are combined to make one or more method uncertainty component(s), which are then combined with the count, efficiency, yield, time, and volume measurement uncertainties.

The re-evaluation of STL Richland uncertainties, based on NIST’s recommended approach, is still in progress but the table below illustrates the adopted approach.


 Table 2.  Uncertainty Components, Sample Preparation and Method


Method and Matrix Categories


Component Uncertainty

Random Effects

Type A Evaluation

Random Effects

Type B Evaluation

Systematic Effects

Type A Evaluation

Systematic Effects

Type B Evaluation

Sub-Sampling


Air Particulate

Sample Homogeneity


2%


Liquid

Sample Homogeneity


1%


Solid

Sample Homogeneity


3%


Sample Preparation1


Air Particulate

Sample Preparation


Sample Volume Measurements (V)


2%


Tracer Equilibrium with Analyte


1%


Liquid

Sample Preparation


Sample Volume Measurements (V)


2%


Tracer Equilibrium with Analyte


0%


Solid

Sample Preparation


Mass (M)


1%


Tracer Equilibrium with Analyte


2%


Method (Sep,Yield Monitor)[2]


Yield Monitor Active, Tracers  (Y)


Tracer Calibration (1%)

Standard  Uncert. (1%-2%)


Yield Monitor, Cold Carriers (Y)


Carrier Calibration  (1%).

Carrier Uncert (0.1%-0.5%)


Yield Monitor (Fixed),  Historic Data (Y)


Past Data Std Dev.

Applicable to current conditions (1-3%)


Impurities/Interference no Separation.


1%


Impurities/Interference/incomplete Separation


2%


Dissimilar Tracer vs Analyte of interest (Cm with Am TracerT),


2%


Table 3. Uncertainty Components, Analytical Alpha Spec

Analytical (Final Prep,Count and Data Reduction)


Method and Matrix Categories


Component Uncertainty

Random Effects

Type A Evaluation

Random Effects

Type B Evaluation

Systematic Effects

Type A Evaluation

Systematic Effects

Type B Evaluation

Alpha Spec

Sample Count ROI (Cs)

√Cs

Move Counting


Tracer Count ROI (Ct)

√Ct

Uncertainty Here?


Background Count (Cb)

√Cb


Δb


Tracer Backgroud Count ROI (Ctb)

√Ctb


Δb


Counting Efficiency (E), Yield Only

Determined from Tracer Count.


Standard Uncert. Included in (Y)


Peak Overlap (PU,U)


0%


Peak Overlap (AM,TH)


4%


Electronic/Instrument Stability


1%


Decay Factor


Δdf


Delta Time Determination


Δt


Branching Ratios


Δbr


Source/Samples Positioning


1%


Sample Density Variations from Calibration

  ED

  Coprecip


1%

2%


Alpha Spec Beta Tracer

Sample Count ROI (Cs)

√Cs


Tracer Count ROI (Ct)

√Ct


Background Count (Cb)

√Cb


Δb


Tracer Backgroud Count ROI (Ctb)

√Ctb


Δb


Counting Efficiency (E)


Calibraton (1%-4%)

2%


Peak Overlap (TH)


4%


Electronic/Instrument Stability (GPC)


3%


Decay Factor


Δdf


Delta Time Determination


Δt


Branching Ratios


Δbr


Source/Samples Positioning


1%


Sample Density Variations from Calibration

  Coprecip


2%


Δ – At this writing, an  undefined delta value.


[1] STL Richland has plans to upgrade it’s VAX/ALPHA loading procedure to use a VAX/ALPHA ODBC driver to load the count data directly into the MSSQL table when the count completes.

[2] Tracer and cold carrier uncertainty are determined by the vial preparation sub-system to RadCalc.